There are few topics that concern all climbing facilities and professionals as universally as compensation, and CBJ’s Climbing Gym Employee Compensation Dashboard 2026 puts more data on the matter at your fingertips. Now in its second edition, this year’s dashboard provides climbing gym employers and employees with a 79% larger total sample size following two years of survey data, updated compensation statistics as well as pay bands for all 34 roles in the database, new figures on paid time off and hours worked, expanded benefits coverage and more.
If you’re asking the kinds of questions below, the dashboard is for you:
- How does the compensation I’m earning or offering compare to someone with similar experience working in a similar role and gym?
- How do those figures change when accounting for cost of living in my area or country?
- How competitive is the paid time off (PTO) and benefits package I’m earning or offering?
- What do gyms of a similar type and size as mine pay their gym managers, setters, coaches, etc.?
- How does my or my staff’s job satisfaction compare to others in a similar role?

Like any survey-based analysis, bear in mind there are always limitations, including the sample set. With 1,590 responses (888 in 2024, 702 in 2026) underlying nearly 40 pages of interactive visualizations, CBJ’s Climbing Gym Employee Compensation Dashboard 2026 is an unparalleled tool for assessing pay, hours worked, PTO and other benefits for climbing gym positions. But the sample size is not large enough to represent all climbing gyms and employees in the world; all averages in the dashboard are thus survey-wide averages, not industry-wide.
There are also differences between the two sample sets (2026 and 2024) and survey methodology which impacted the results. While similar in many respects, in 2026 the sample skewed more toward employees working at smaller gyms with lower monthly membership prices and in smaller markets with lower incomes, for example, which could have slowed growth for some survey compensation averages and impacted those not adjusted for cost of living in particular.
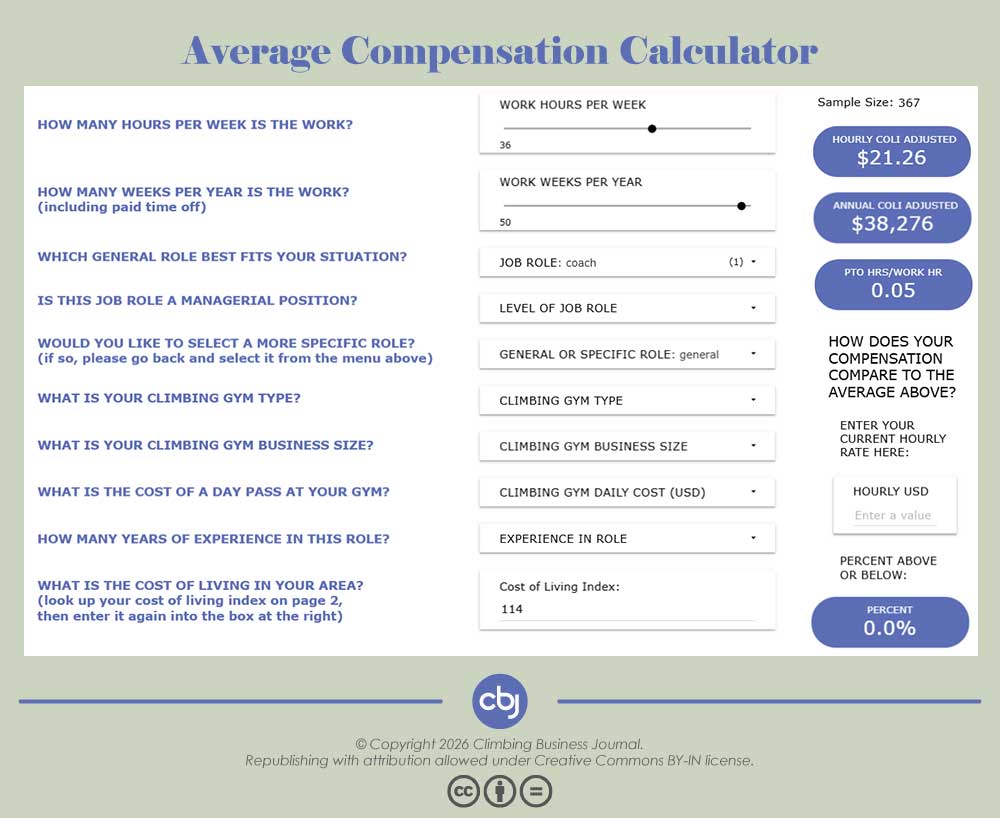
So, be sure to enter your own cost of living index in the dashboard and use the menus on each page to filter the results for different gym characteristics. The calculator on page 14 was built specifically to help you make quick comparisons based on your and your gym’s situation. (More limitations as well as the full survey methodology are detailed at the end of this report.)
After crunching the dashboard numbers, below are four takeaways our team had on how job satisfaction is changing in 2026, ongoing concerns around burnout, the importance of PTO and other benefits for staff retention, and compensation gaps that still need bridging. More stats and charts can be found in CBJ’s Climbing Gym Employee Compensation Dashboard 2026.
Access the Dashboard
- Survey participants received an email with instructions for lifetime access to view both dashboard versions, as well as a coupon for $30 off any new CBJ membership.
- CBJ members at paid levels get the full experience: Plus and Premium members can access the complete dashboard as well as an essentials dashboard for quick analysis of key results. Biz and Pro members can access the essentials dashboard.
- If you’re not yet a CBJ member, learn more and enroll here. Every paid level is packed with valuable benefits starting at $150/year.
Takeaway #1: Job Satisfaction Is Up Across the Board
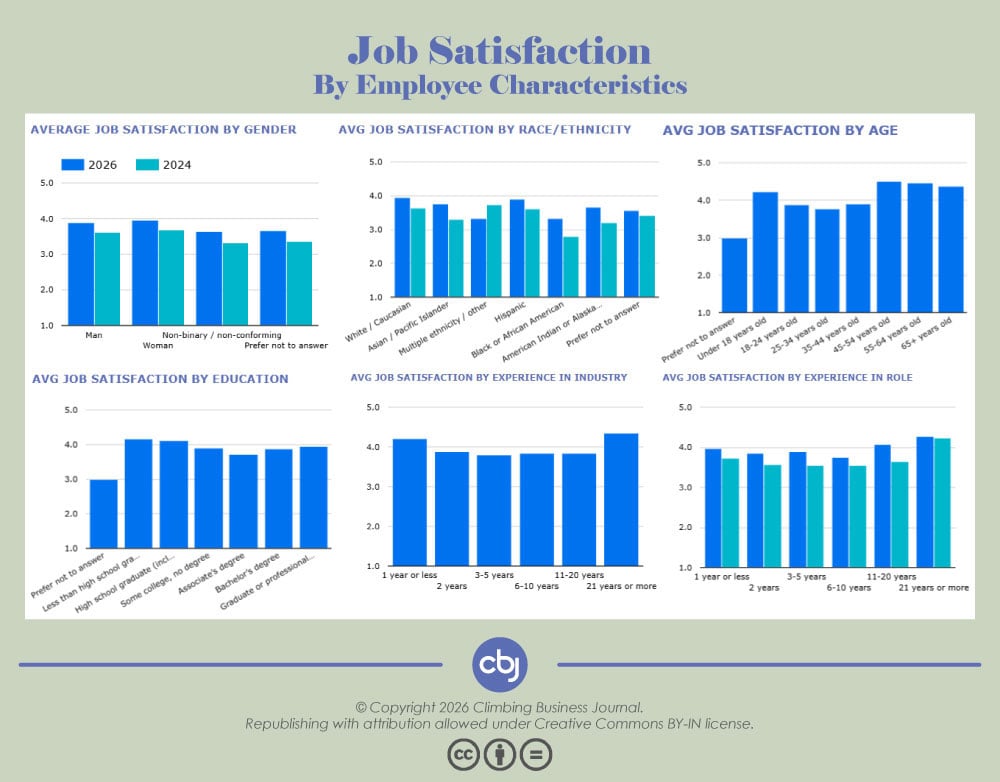
Of all the comparison figures in the dashboard, perhaps none stand out more poignantly than the increases in job satisfaction from the 2024 to 2026 sample set (measured on a 1 to 5 scale, with 1 signifying not satisfied and 5 signifying very satisfied.) When breaking down average job satisfaction by responding employees’ experience in their role, facility size and cost, and market population and income levels, those averages increased practically across the board. For 26 of the 30 job roles (87%) covered in both surveys, average job satisfaction increased.
An ensuing question, then, is why, and two contributing factors could be increased compensation and expanded benefits for many respondent subsets. Similar to job satisfaction, average compensation metrics increased across most employee, facility and market characteristics—particularly among respondents in the South and West, where average salaries adjusted for cost of living increased by 27% and 21%, respectively, from the 2024 to 2026 survey results. On the other hand, those averages increased for only half the job roles represented in both surveys, but that outcome was more likely due to the change in sample set and inclusion of precise hours worked questions in 2026 than a material decrease, given the rate of wage inflation in the U.S.
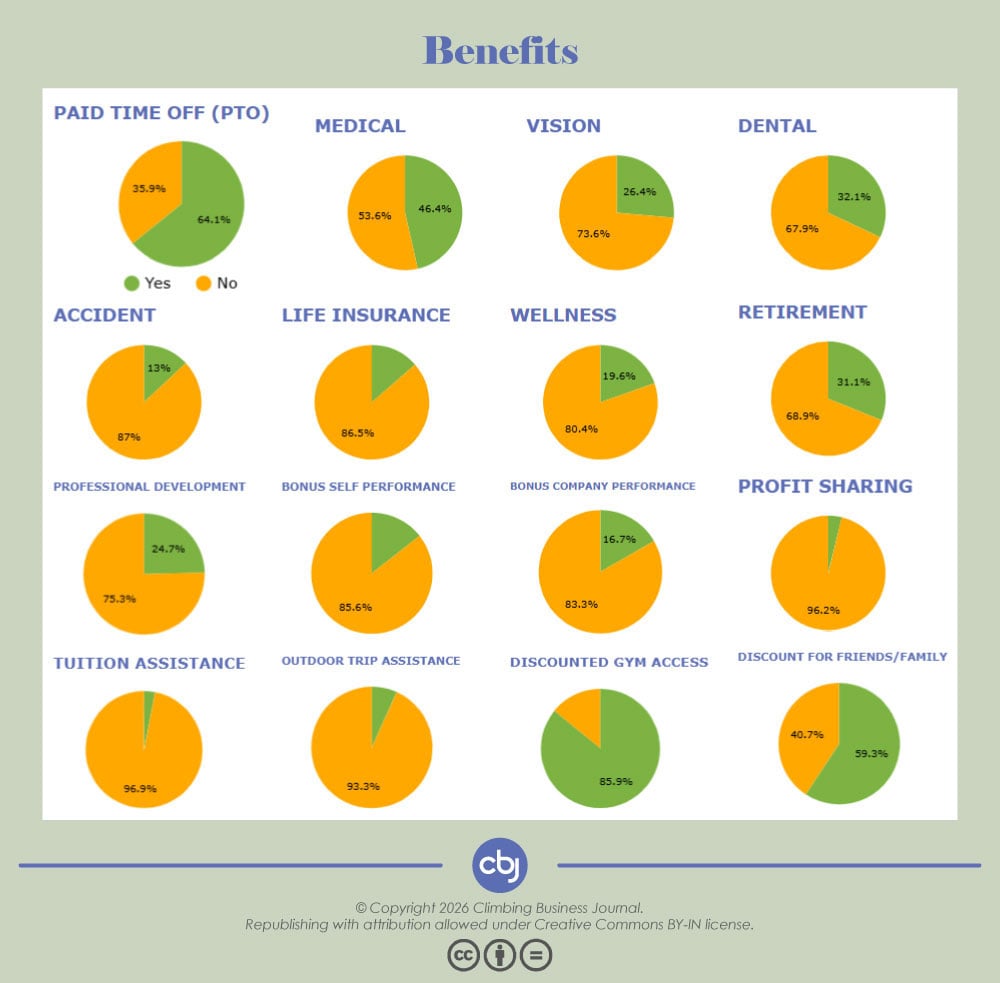
For benefits, however, the changes from the 2024 to 2026 survey results were more mixed. When comparing respondents working full-time at their primary facility, the percentage who were offered the benefits covered in both surveys—medical, vision, dental and life insurance, wellness benefits, a retirement plan, professional development reimbursement, profit sharing and tuition assistance—increased for nearly every benefit, but the opposite was true for part-time respondents, who were less likely to be offered each one of those benefits in the 2026 results.
Another potential factor is the economic headwinds cited by operators in CBJ’s 2025 Gyms & Trends Report and Climbing Gym Operator Forecast Dashboard. As multiple studies have shown, contrary to what one might think, in harder economic times job satisfaction can actually increase, in part because job prospects decline and it’s easier to appreciate having steady employment—especially in a passion-driven industry like climbing—as well as raises in compensation, even if those raises may not be keeping up with the rate of price inflation.
Still, such a noticeable jump in average job satisfaction from the 2024 to 2026 sample sets, when coupled with increases in multiple compensation and benefits figures, indicates many gyms represented have continued prioritizing retention of their most involved employees, while facing economic challenges like rising costs themselves and decreased consumer spending.
Takeaway #2: Burnout Is an Ongoing Concern
For the first time, CBJ’s Climbing Gym Employee Compensation Dashboard this year shed light on how many hours per week respondents are working, and those figures largely supported the belief that risk of burnout is an ongoing concern. Among the U.S. full-time respondents in 2026, nearly one in four (24%) are averaging more than 40 work hours per week at their primary facility.
Granted, that figure is less than half the economy-wide percentage (50%) of U.S. full-time employees who work beyond the 40-hour work week, according to national surveys on the topic. However, CBJ’s survey only covered the number of hours an employee works at their primary facility, not work hours at other climbing facilities or brands, nor businesses outside the industry. So, it’s likely that more than a quarter of the full-time employees surveyed—as well as many part-time employees surveyed—are working over 40 hours per week across all their jobs.
Long hours, of course, is only one factor that can contribute to burnout. Daily working conditions matter too, studies show, and all these factors were noted in the survey comments again this year. Several respondents emphasized feeling spread thin while wearing multiple hats, underpaid given their responsibilities, and struggling to keep up with a rising cost of living in their area. Routesetters and coaches, for example, are essential to providing the core offerings of a climbing gym, yet the two managerial roles with the lowest average job satisfaction in the 2026 survey results were Assistant Head Routesetter (3.47 on a 1 to 5 scale) and Assistant Head Coach (3.56).
Takeaway #3: PTO Plays a Big Part in the Equation
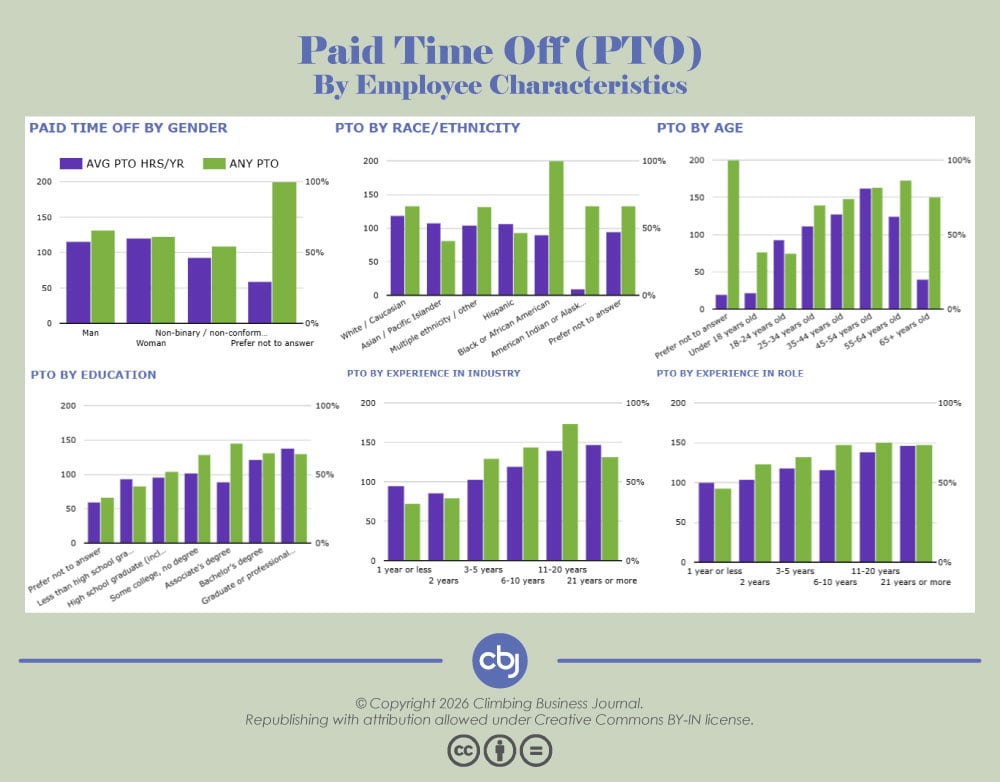
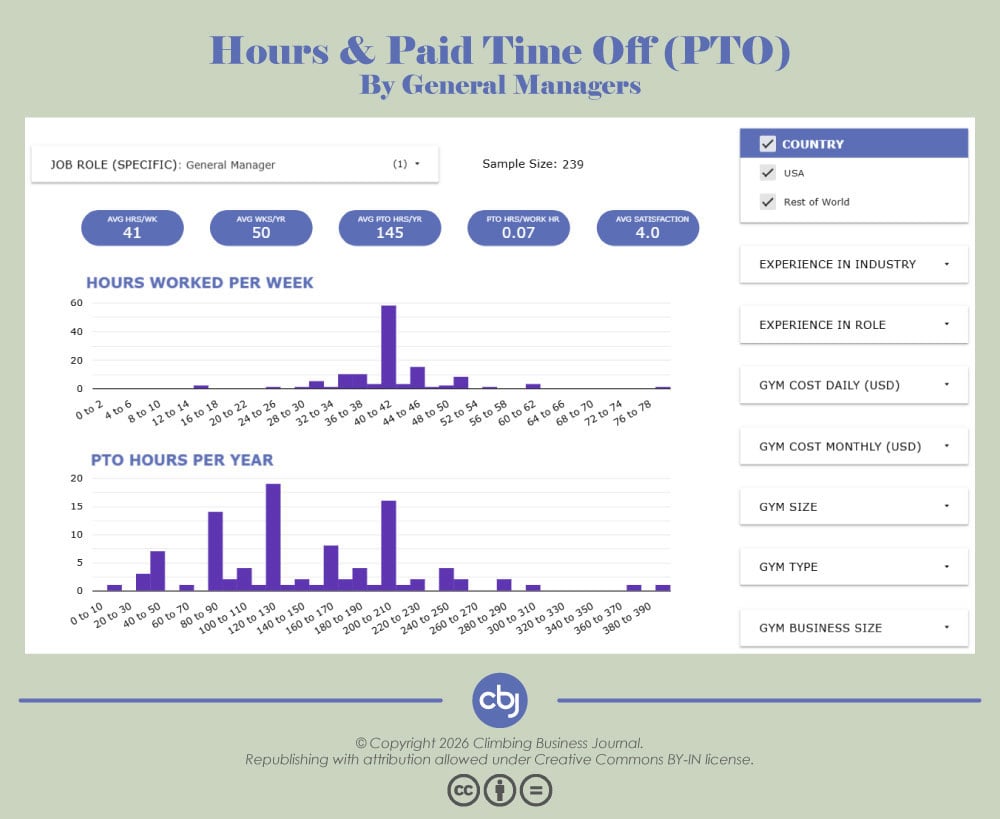
One of the primary ways to combat burnout is through paid time off (PTO), and this year’s CBJ Climbing Gym Employee Compensation Dashboard dove deep into that subject, with multiple pages dedicated entirely to PTO—which in CBJ’s survey was defined as all forms of paid time off, including paid bank holidays, paid vacation days, paid sick days, etc. In addition to PTO bands for each of the 34 job roles covered in the 2026 survey results, the dashboard includes PTO breakdowns by various employee and facility characteristics, as well as stats on average PTO hours per work hour among employees who entered PTO hours.
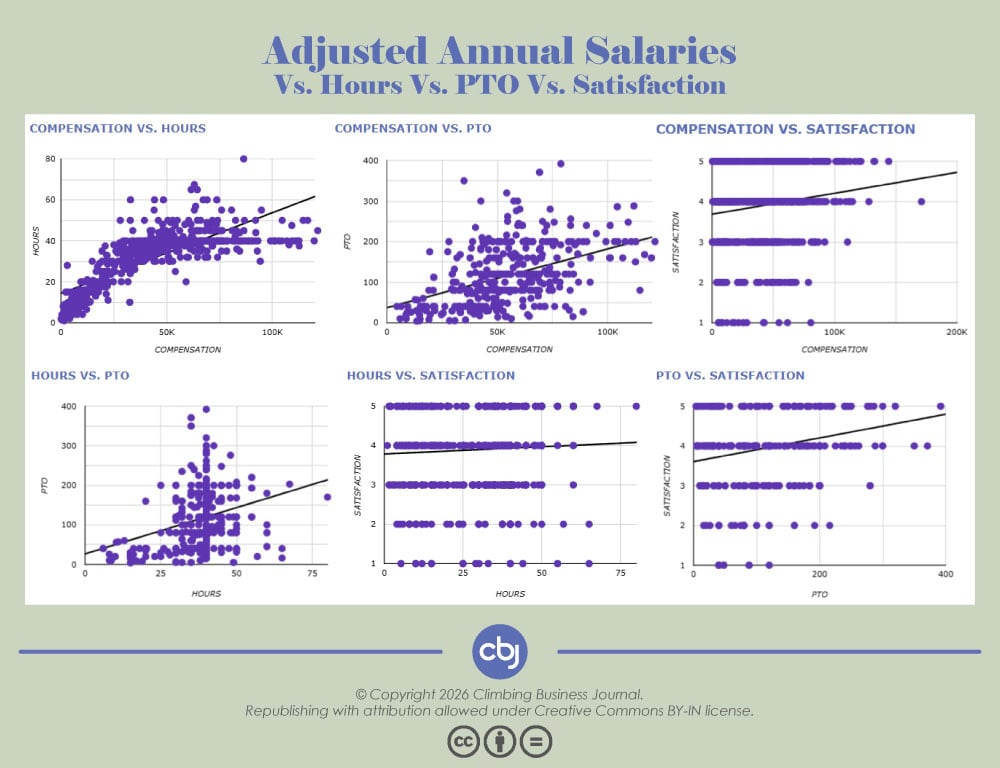
As expected, the 2026 survey results showed that employees receiving higher compensation and being offered more PTO tended to have higher job satisfaction, as seen in the charts below, but it was not always the case that those who worked more were offered more PTO. Of the full-time respondents working more than 40 hours per week at their primary facility who entered PTO hours, nearly half (49%) were offered less than the survey-wide average PTO (116 hours per year).
It was also not always the case that PTO was a given, especially among part-time respondents. In the 2026 survey results, 74% of part-time respondents and 9% of full-time respondents were offered no PTO at all (and must work in a jurisdiction where it’s not legally required).
Some of the job roles that did score above average in the 2026 survey results for both average PTO and average PTO hours per work hour included admin/HR/support roles, general manager, routesetting director and head routesetter, head coach, and maintenance staff.
Takeaway #4: Compensation Gaps Persist
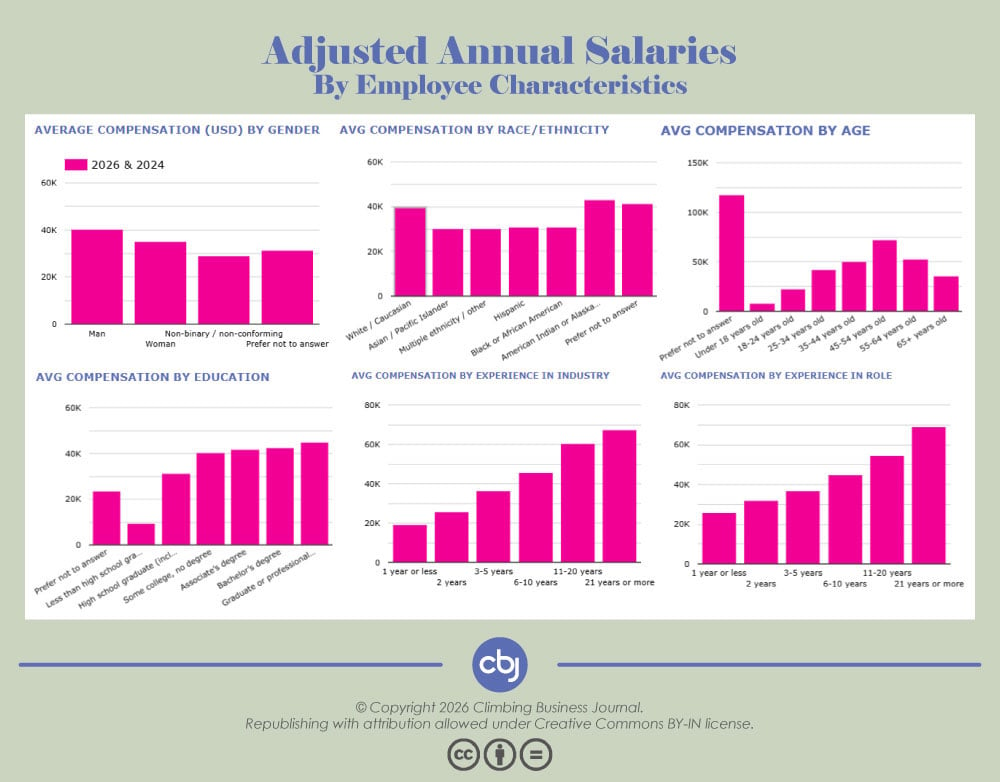
Last year’s report noted differences in average compensation between employees of different genders and different races and ethnicities surveyed in 2024, and those gaps largely persisted in the 2026 survey results—most noticeably across genders (since the sample size was more limited for some races and ethnicities). Among 2026 respondents, when comparing annual salaries adjusted for cost of living, for example, the average adjusted salary was 11% lower for women than men and 23% lower for non-binary or non-conforming respondents than men.
Similar to the 2024 results, when accounting for job experience—and the educational attainment data gathered for the first time in 2026—those gaps can get even bigger. Among 2026 respondents with 11 years of experience or more in their role and a bachelor’s degree or higher, for instance, the average adjusted salary was 29% lower for women than men.
Also noteworthy are the differences across job roles, with two years of survey data underlying the numbers. When combining the 2026 and 2024 results, the average adjusted salary was higher for men than women across 64% of the job roles (that have a sample set for men and women).
While the gender pay gap in the survey results may be lower than the economy-wide average in the U.S.—with recent reports estimating U.S. women make 82 cents for every dollar U.S. men make, compared to 89 cents in CBJ’s survey data, based on average adjusted salaries—there still is an observable contrast. And any gap—whether between genders, races and ethnicities, or other demographic—is a reminder for employers and employees in the industry to continue being proactive about fostering equitable workplaces for all.
Methodology
The industry-leading CBJ Compensation Survey for Climbing Gym Employees has now been conducted for two years: in 2026 (from April 1 to May 31) and in 2024 (from November 29 to December 31). The survey was posted on Climbing Business Journal’s digital platforms and was distributed in partnership with a variety of industry organizations.
Respondents
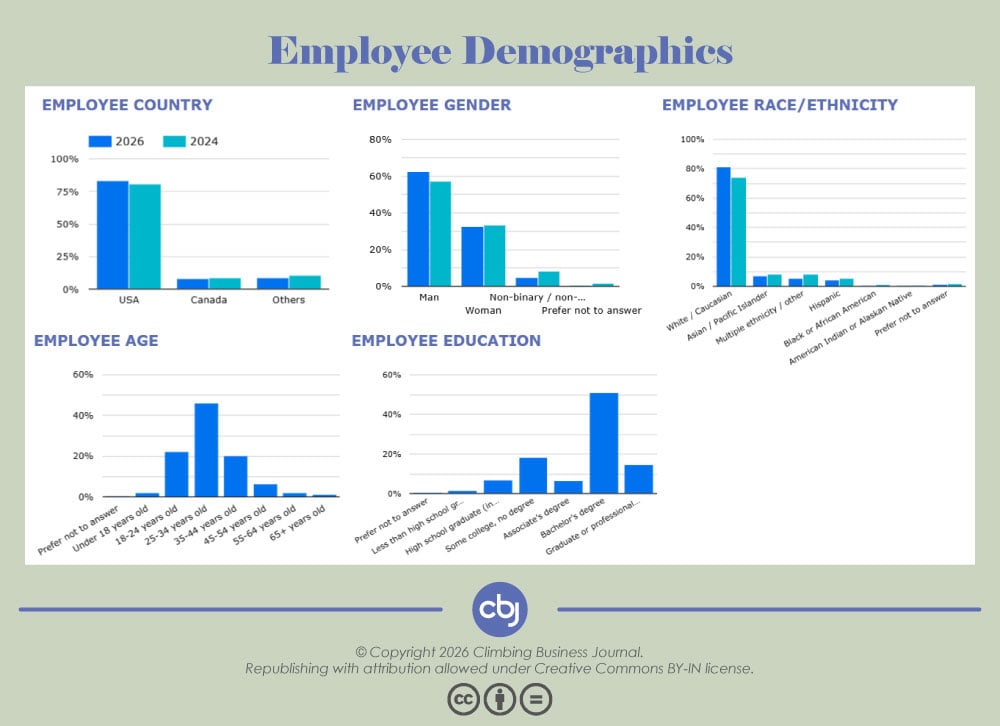
Across the two surveys, there was a total of 1590 responses (702 in 2026, 888 in 2024) from climbing gym employees with valid submissions, representing 38 countries altogether. The majority of responses came from the United States (82%), followed by Canada (8%).
In 2026 compared to 2024, respondents were more likely to be a manager (63% in 2026 vs. 53% in 2024), have more experience in their current role (34% with 6+ years in 2026 vs. 29% in 2024) and have more experience with their current employer (27% with 6+ years in 2026 vs. 17% in 2024). But as noted in the introduction, among responses with available facility and market data, they were also more likely to work at smaller gyms (55% under 15K climbing square feet in 2026 vs. 44% in 2024) with lower monthly memberships (49% under $80/mo in 2026 vs. 43% in 2024) and in smaller markets (68% under 2.5 million people in 2026 vs. 55% in 2024) with lower per capita incomes (53% under $47K in 2026 vs. 39% in 2024), which could have slowed growth for some survey compensation averages and impacted those not adjusted for cost of living in particular.
Although the survey results were limited by the sample size, a variety of genders, races and ethnicities, experience levels, job roles, facility types and market sizes were represented in the survey, providing a data-driven snapshot into how much compensation employees at climbing gyms around the world (especially the U.S.) are earning.
Topics
The questions asked in the surveys (including some new ones in 2026) spanned a variety of compensation-related topics and covered the following:
- Employee demographics: country, gender, race/ethnicity, age, education
- Facility information: location, business size, climbing type, square feet of climbing, daily/monthly cost at primary facility where the employee works
- Job classification and schedule: full-time or part-time, full employee or contractor
- Job experience: number of years working in current role, with current employer, and in the climbing industry
- Job roles: primary and (if applicable) secondary job role at the facility
- Job satisfaction: 1 to 5 scale, with 1 signifying “not satisfied” and 5 “very satisfied”
- Compensation structure: hourly wage, annual salary, monthly salary, biweekly salary, weekly salary, per unit (per day, per route, per class, etc.)
- Compensation currency: US dollars, Canadian dollars, etc.
- Compensation amount: amount paid in that currency at primary facility
- Hours worked: average hours in a week and weeks in a year (including paid time off) at primary facility
- PTO: average hours of paid time off in a year (including paid bank holidays, paid vacation days, paid sick days, etc.) at primary facility
- Other Benefits: medical insurance, vision insurance, dental insurance, accident insurance, life insurance, wellness benefits, retirement plan, professional development reimbursement, bonuses based on employee’s performance, bonuses based on company’s performance, profit sharing, tuition assistance, outdoor climbing trip assistance, free/discounted gym access for employee, free/discounted gym access for friends/family, free/discounted gym retail or pro deals at primary facility
- Cost of living: information related to the cost of living where primary facility is located (cost of living index, market region, market total population, market median and mean household income, market per capita income)
Privacy
Every effort was made to protect the privacy and identity of all the employees who responded to the survey as well as the facilities where they work. Survey respondents were given the option to not provide the name and precise location of their current employer and instead only provide basic facility information (business size, climbing type, daily/monthly cost) and cost of living information. If the name and location of a current employer was provided, these details were only used to look up basic facility information from CBJ’s comprehensive Gym Map and cost of living information. (CBJ’s full data privacy policy can be found here.)
Compensation
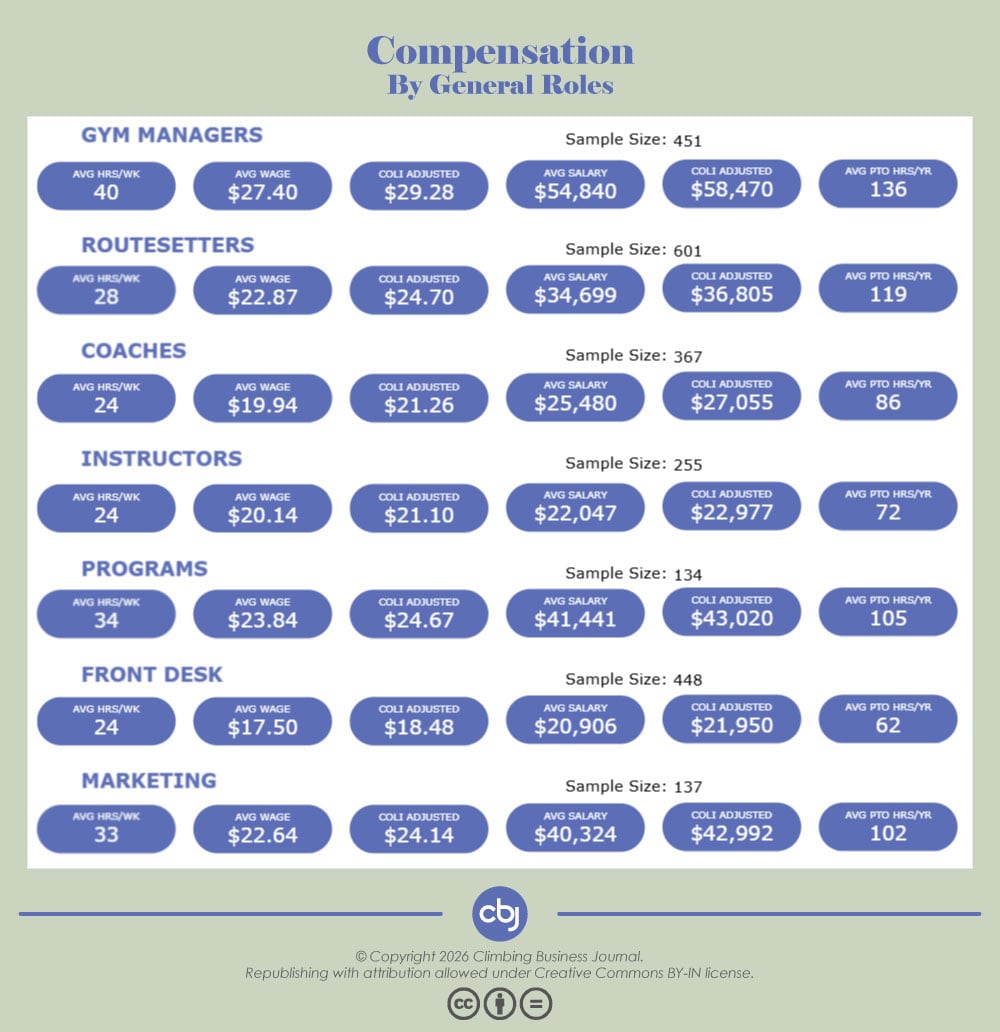
In addition to differences between the sample set for 2026 compared to 2024, it’s important to note some differences in compensation reporting for the two years as well.
In 2024, the first edition of the survey was purposefully kept more limited to increase turnout, so some estimation was needed to compare submissions across different compensation structures and job classifications, since hours/weeks worked were not known. Following new learning from the 2026 survey results, 2024 estimates in the current dashboard have been updated based on 2026 full-time and part-time average hours/weeks worked across specific job roles. In 2026, for the expanded follow-up survey, respondents were asked to provide exact figures for their average hours/weeks worked in a year, and calculations were then made based on an employee’s listed pay rate and structure (hourly, annual, monthly, biweekly, weekly) to determine their precise hourly wage and annual salary. As a result, the 2026 compensation averages represent more accurate figures and despite continued inflation may be lower for certain roles than the 2024 averages, which in the current dashboard assume more parity in hours/weeks worked across specific full-time roles and across specific part-time roles.
Currency
Once the hourly wages and annual salaries were calculated for all employees, pay rates for employees not paid in US dollars (USD) were converted to USD. These calculations were made using the currencies reported by respondents and public exchange rate data on the U.S. Department of the Treasury’s Fiscal Data website for the latest quarter available at the time (January 1 2026 to March 31 2026). Both 2026 and 2024 figures were converted to USD based on these exchange rates.

Cost of Living
The cost-of-living-adjusted hourly wages and annual salaries in CBJ’s Climbing Gym Employee Compensation Dashboard 2026 were then calculated using a mix of public and proprietary data. Compensation figures for employees outside the United States were initially adjusted to U.S.-equivalent values, based on public cost of living data on the WorldData website, which was accessed in June 2026. This global cost of living index is based on a value of 100 for the United States and, according to the website above, combines “the OECD, the Worldbank, the IMF and Eurostat figures and has been completed by [WorldData’s] own researchers.”
Compensation figures for employees within the United States were also initially adjusted to a value of 100, but this time based on proprietary, national cost of living data from The Council for Community and Economic Research (C2ER), the leading source of cost of living data in the U.S., with 100 representing the national average. To ensure the most survey responses could be tied to a relevant cost of living index (COLI), C2ER’s metro-level index was used (for May 2026), which is “based on an econometric model that identifies key determinants of an area’s cost of living,” per the C2ER website. By default, the COLI adjusted figures in the dashboard are set to the survey-wide average COLI of 114, so be sure to look up your own COLI on Page 2.
Other information related to the cost of living where an employee works that was incorporated in CBJ’s analysis included the latest five-year American Community Survey data (2024) for metropolitan/micropolitan core-based statistical areas (CBSAs), reported by the U.S. Census Bureau. These figures included the region, total population, median household income, mean household income and per capita income for a CBSA. Five-year estimates for 2024 were chosen because these figures are more stable and comprehensive than one-year ACS estimates and provided the most up-to-date, complete data for the CBSAs used for C2ER’s metro-level cost of living index.
Job Roles
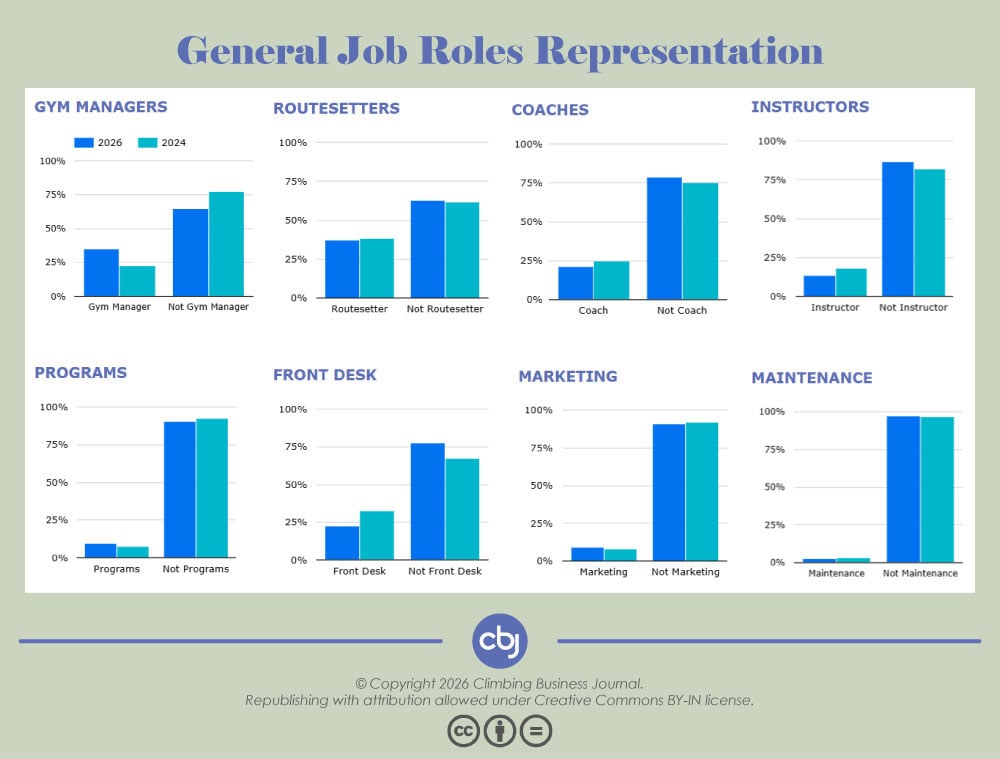
Employees were asked in the survey to select their primary job role and, if applicable, a secondary job role from the list of options provided. If an employee selected both a primary and secondary job role, their compensation was counted for both roles, and in the case where two compensation figures were provided those pay rates were combined (in 2026) or averaged (in 2024). Job roles were also delineated as managerial or staff roles, based on whether some managerial tasks were expected to be part of the work, and not necessarily whether hiring duties were involved (please note that the National Labor Relations Board may have different definitions for what constitutes a managerial versus staff position at a climbing gym). The list of job roles provided in the survey spanned the following positions in gym management, routesetting, coaching, instruction, programming, the front desk, marketing and maintenance (with job roles delineated as managerial positions in italics):
- Gym Management: executive (2+ markets), facilities director (2+ facilities), admin/HR/support director (2+ facilities), general manager (1 facility), admin/HR/support manager (1 facility), assistant general manager, retail manager, admin/HR/support staff, retail staff
- Routesetting: routesetting director (2+ facilities), head routesetter (1 facility), assistant head routesetter, routesetter
- Coaching: head coach (1 facility), assistant head coach, coach (elite/comp teams), coach (recreational)
- Instruction: instructor (fitness/yoga), instructor/guide (outdoor climbing), instructor (indoor climbing), personal trainer, wall supervisor
- Programming: programs director (2+ facilities), programs manager (1 facility), party/group staff
- Front Desk: shift supervisor, desk staff
- Marketing: marketing director (2+ facilities), marketing manager (1 facility), event manager (1 facility), marketing staff, event staff, photo/video staff
- Maintenance: maintenance staff
Paid Time Off
Whereas the 2024 survey covered benefits that required less additional information on hours/weeks worked—medical, vision and dental insurance, wellness benefits, professional development reimbursement, etc.—the expanded 2026 survey also dove into paid time off (PTO) in depth. Respondents were asked to share whether they were offered any form of PTO at their primary facility—including paid bank holidays, paid vacation days, paid sick days, etc.—and how many total PTO hours they were offered in a year. As well as PTO averages for all 34 roles in the dashboard, calculations were made for the average PTO hours offered per work hour, based on an employee’s reported hours/weeks worked at their primary facility. To provide the most accurate estimates to dashboard users offering or being offered PTO, entries for employees not offered any PTO or who did not enter PTO hours were excluded from the average PTO calculations.
Limitations
Some limitations of this report and accompanying dashboard are inherent to that of any survey-based analysis, such as the differences between the 2026 and 2024 sample sets and survey methodology, as well as a limited sample size that may not be fully representative of different job roles at different climbing gyms in different places. In the future, a larger segment of employees in the climbing industry could be surveyed for an even more robust analysis.
Additionally, not all job roles are titled the same way across different facilities. Sometimes an employee at one facility may be working in a “programs manager” role, for instance, that may be comparable to a “programs director” role at another facility. While this year’s survey did state which roles spanned one facility versus two or more facilities, in the future more tips could be provided to help employees make the most applicable selection for their job role, and more job roles could be added to the survey.
Finally, there can be large differences in contexts across different areas and countries. While cost of living data was incorporated into this analysis to help account for some of those differences, comparing compensation figures across different places is still not always an “apples-to-apples” comparison. Whether a country has universal healthcare and other social support services, for example, can significantly impact these comparisons. In subsequent editions of this analysis, additional economic, political and social factors could be factored into the equation.
Acknowledgements
Thank you again to everyone who helped bring CBJ’s Climbing Gym Employee Compensation Dashboard 2026 to life, including:
- All the employees who made this analysis possible by taking the survey.
- Joe Robinson, who built the dashboard and drafted this report.
- Scott Rennak, who built the survey and guided each step of this project.
- Megan Cheek, who provided expert feedback on the survey and dashboard.
- The entire CBJ team, who keep us going strong (Naomi Stevens, Holly Chen and many others)
- Asana, Rhino Skin and PhysiVāntage, who fueled the survey giveaways.
- And all the advertisers and members in the CBJ family, who power our work.
Contribute to the Research
Got an idea for how to improve these tools, a question about the data, or a comment to share? We’d love to hear from you! Fill out the short, three-question feedback form here anytime.