In 2026, there’s no denying that economic conditions have been challenging for many climbing gym businesses. As operators navigate the current headwinds, it’s worth taking a moment to celebrate where gyms have been providing communities with ample space to climb and connect.
When it comes to the amount of indoor climbing available, in many places it’s still a good time to be an indoor climber. Following four decades of industry growth, there were nearly 700 commercial climbing gyms around the country at the start of 2026, according to CBJ’s 2025 Gyms & Trends report. With about 7.5 million square feet of climbing spread across those facilities, many climbers have more choice than ever in which walls they climb, from tall roped walls inside large full-service gyms to boulders inside large bouldering hubs or boutique studios.
Of course, the quantity of commercial climbing in an area isn’t the only factor impacting an indoor climber’s satisfaction—for many climbers, the time and cost it takes to access a facility, atmosphere at the gym, amenities and programs, proximity to outdoor climbing and more can factor into the equation. But more often than not, a greater supply of gyms and walls comes with a higher likelihood of demand being met, and that supply is exactly what the climbing wall density index (CWDI) measures in CBJ’s Climbing Gym Market Report & Dashboard.

The first of its kind made publicly available, the CWDI was created as one way to measure climbing gym and wall surface density in an area, evaluating how much commercial climbing a place has relative to its size. Combining CBJ’s industry-leading gym and wall map data with the U.S. Census Bureau’s latest 5-year (2020-2024) ACS data for CBSAs, the CWDI factors in a market’s total number and concentration of commercial climbing gyms, total wall surface across those gyms, total population and total land area (see the report for the full formula).
It’s important to note that the CWDI is not a measure of saturation. Some markets may have low density yet struggle to sustain the gyms they have, while others may have high density and still have room to welcome more growth in the years ahead. Instead, the CWDI provides a quick glance at where there may be more or less commercial climbing right now, based on the given model.
Without further ado, below are 10 major U.S. cities and markets (above a population of 250,000 people in the metropolitan area) with the highest climbing wall density index in CBJ’s Climbing Gym Market Report and Dashboard. In tandem with this article, be sure to check out the Top 10 opportunity score rankings here and find more insights from the analysis here.
Access the Tools
- CBJ Premium members get them FREE: Download the report here for FREE and contact us to set up one month of FREE dashboard access!
- CBJ Plus and Pro members can purchase the report here and here ($200 / $300) and contact us for dashboard access ($500/mo / $600/mo).
- If you’re not yet a CBJ member, learn more and enroll here. Every paid level is packed with valuable benefits starting at $150/year.
10. Fort Collins-Loveland
- Region: West
- State: Colorado
- Population: 367,368
- Number of Roped Gyms: 4
- Number of Bouldering Gyms: 1
- Square Feet of Climbing: 53,674
- CWDI Score: 9.6
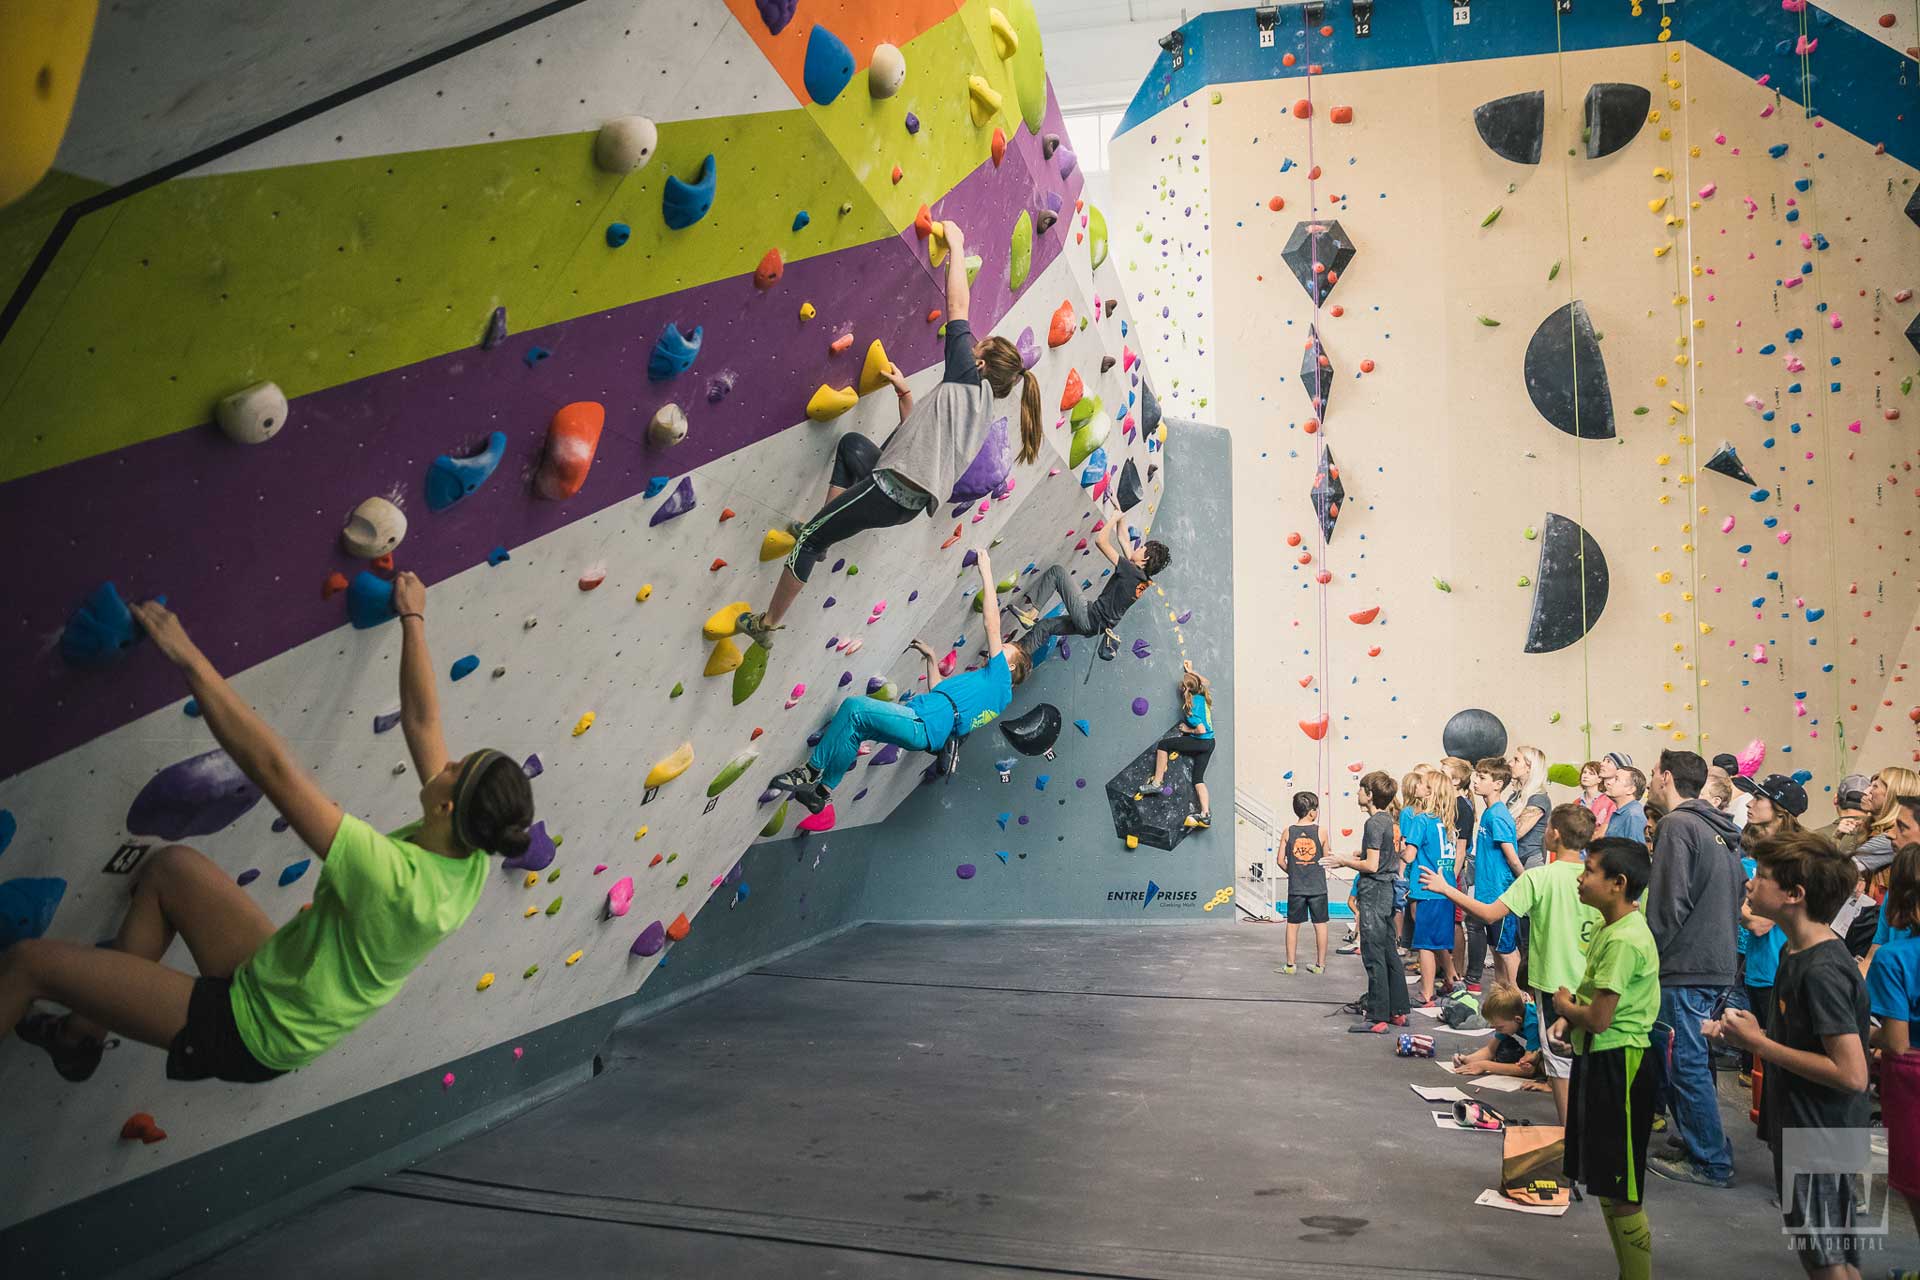
Coming in 10th place is Fort Collins-Loveland, along the Front Range of Colorado—which is home to four markets ranking in the Top 25 in CWDI. While having the second-fewest commercial climbing gyms on this list and second-least amount of wall surface across those facilities, the Fort Collins area also has the second-lowest population and is smaller than many other metropolitan areas, making it still an indoor-climbing-dense market. After Inner Strength opened in 1993—closed since 2017—five more climbing gyms have since expanded access to commercial climbing in the area. In a region renowned for its outdoor climbs, climbers around Fort Collins can also access a plethora of roped climbing and bouldering options indoors.
9. Portland-Vancouver-Hillsboro
- Region: West
- State: Oregon
- Population: 2,520,987
- Number of Roped Gyms: 5
- Number of Bouldering Gyms: 6
- Number of Announced Gyms: 1
- Square Feet of Climbing: 149,422
- CWDI Score: 10.1
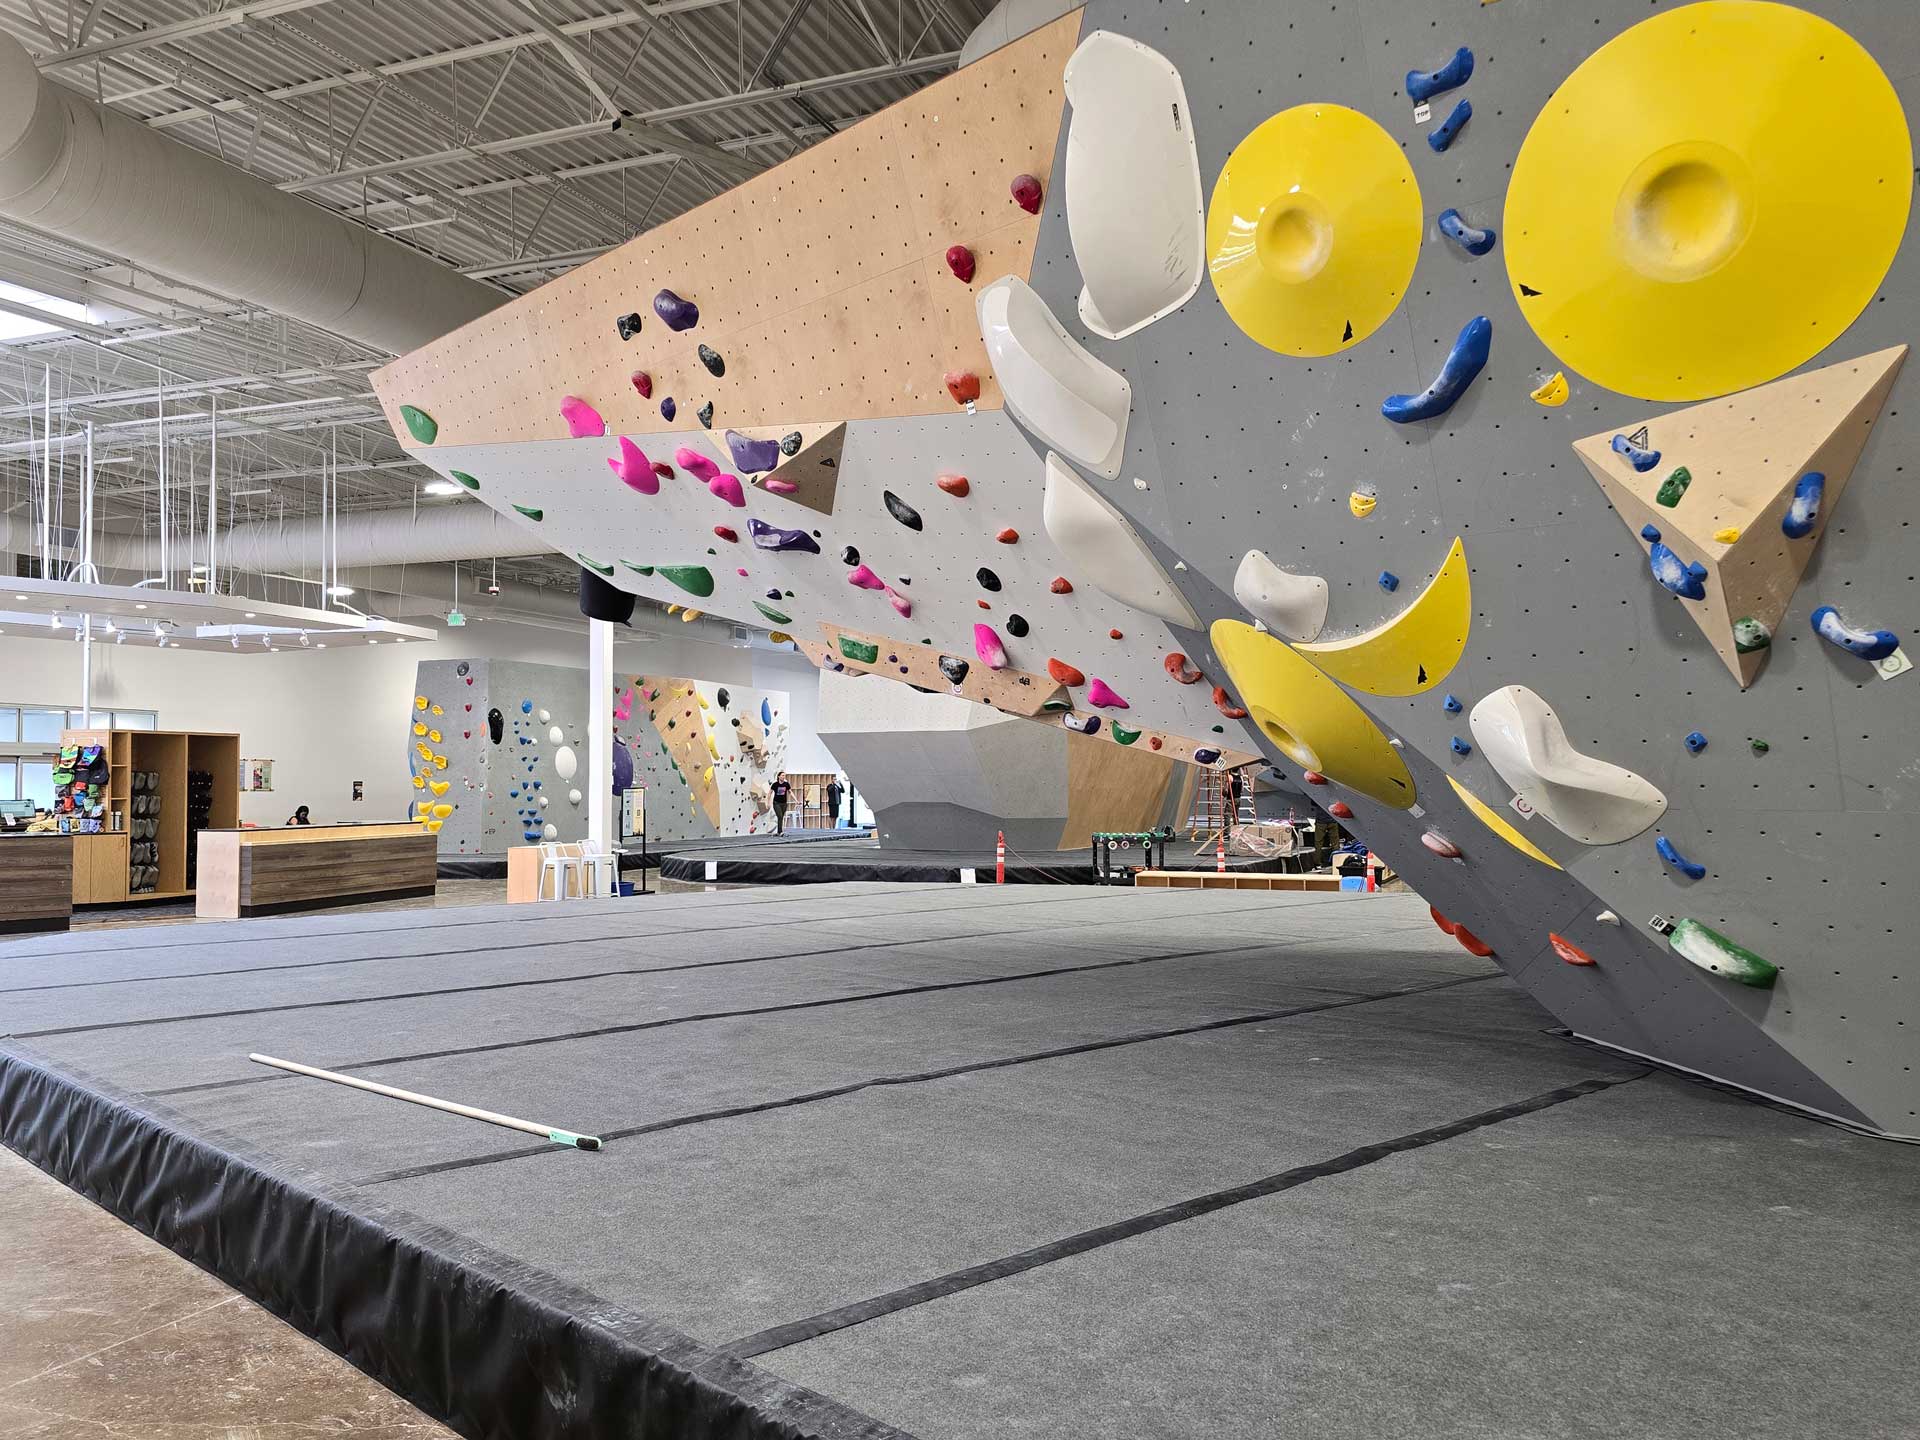
In 9th place, the Portland-Vancouver-Hillsboro metropolitan area, in Oregon, has been serving indoor climbers longer than all but one market on this list. The original Portland Rock Gym opened in 1988 and is regarded as the second commercial climbing gym in the United States. Today, the greater Portland area now offers climbers 11 commercial facilities—five full-service and six bouldering-focused gyms—including three by The Circuit, which has been operating in Portland for over 20 years. With nearly a dozen climbing gyms to visit—a 12th facility, Movement Clackamus, is coming to Happy Valley in 2027—and nearly 150,000 square feet of climbing to ascend, Portland climbers are in one of the top indoor-climbing-rich areas.
8. San Diego-Chula Vista-Carlsbad
- Region: West
- State: California
- Population: 3,288,774
- Number of Roped Gyms: 6
- Number of Bouldering Gyms: 8
- Square Feet of Climbing: 172,916
- CWDI Score: 12.5
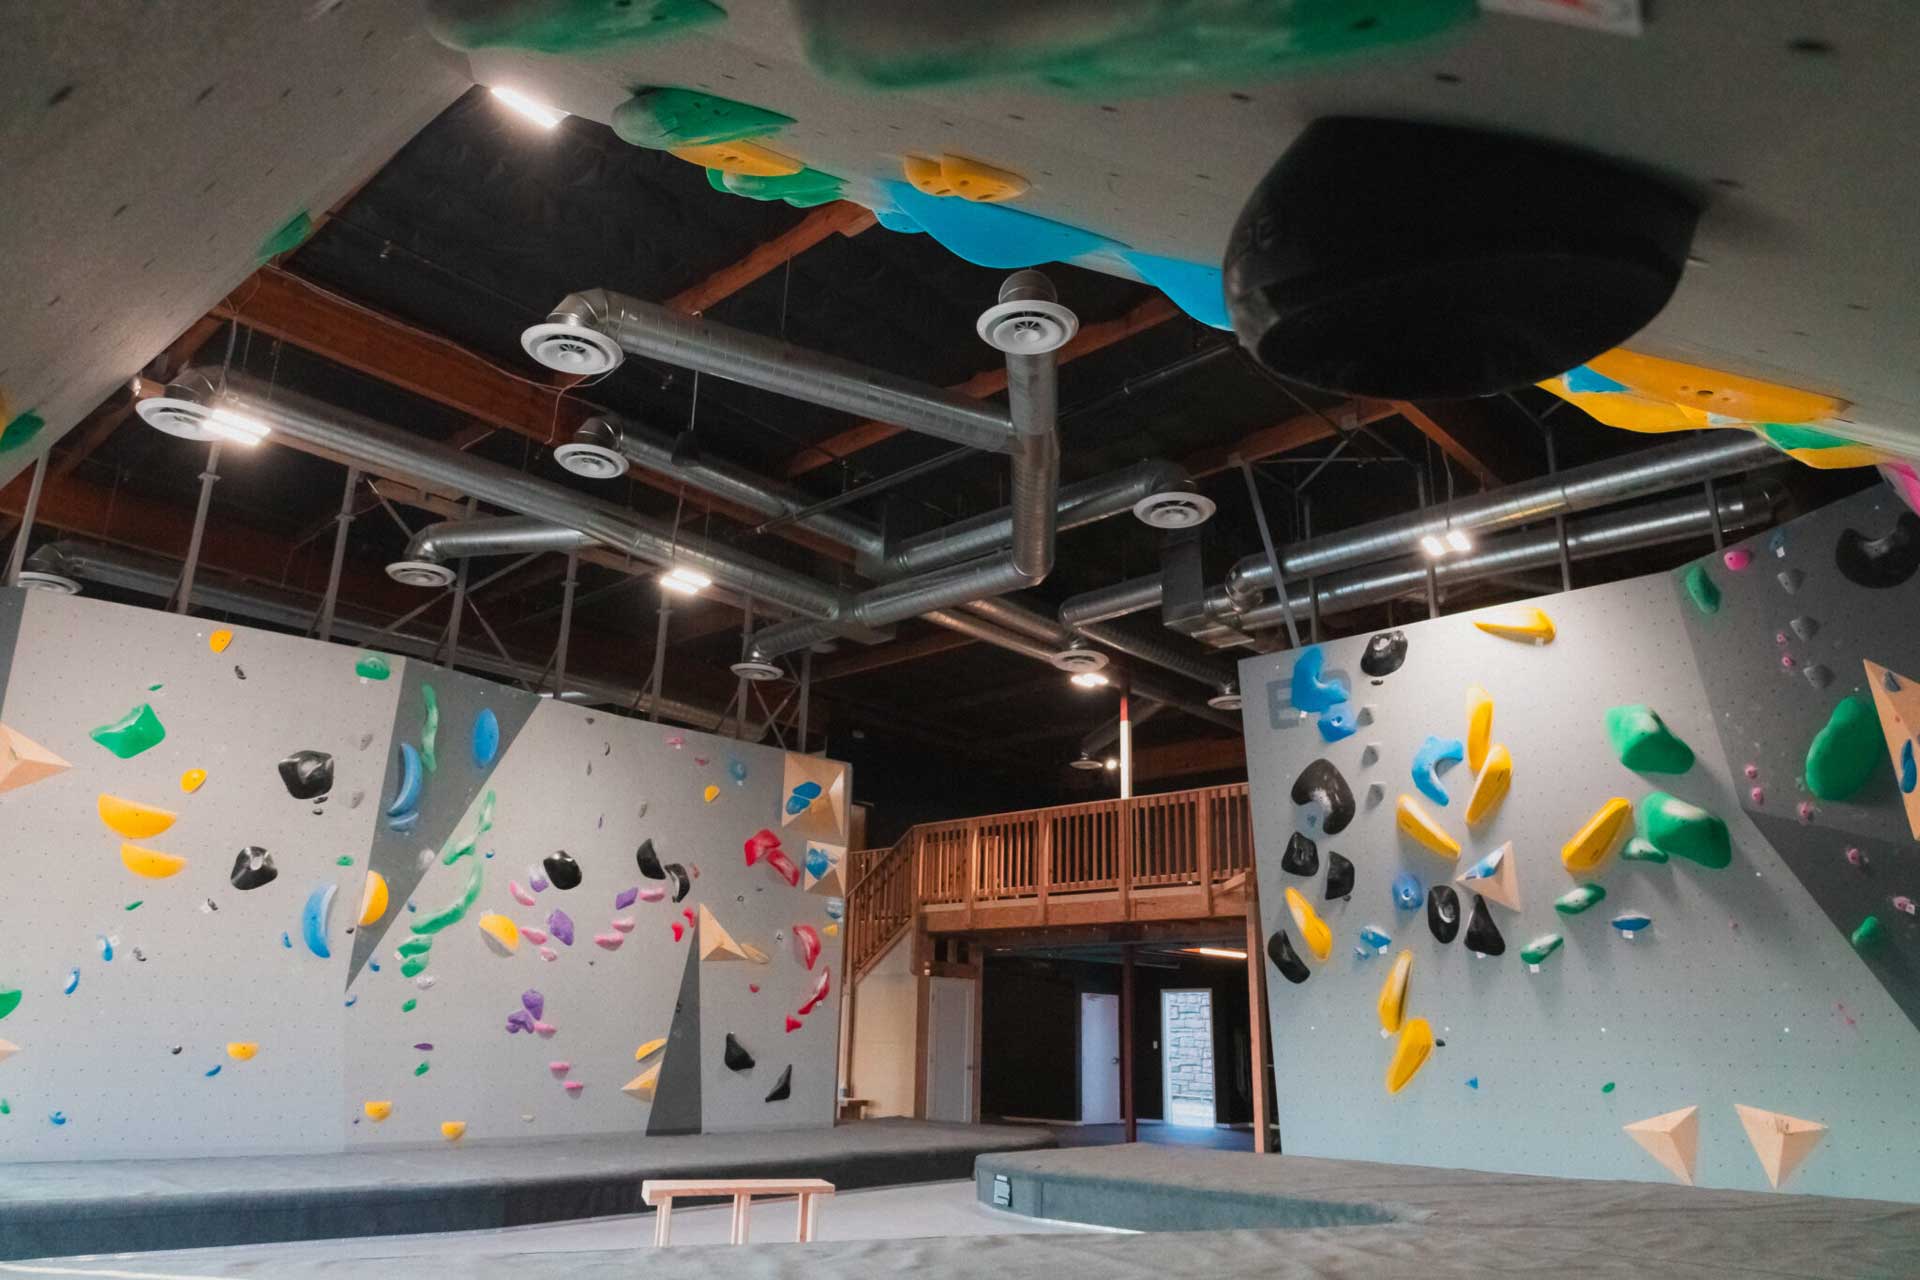
With the 8th-highest climbing wall density index in the U.S. is the San Diego-Chula Vista-Carlsbad metro area. One of three California markets on this list, the San Diego area welcomed its first commercial climbing gym back in 1993—the original Vertical Hold Sport Climbing Center, which now operates gyms in San Diego and Poway—and today is home to two other multi-location climbing gym businesses, in VITAL and Mesa Rim. Both developers launched their first location in the greater San Diego area and have since grown to run half a dozen or more gyms around the country. In total, climbers around San Diego can choose from 14 climbing facilities in the area, with over 170,000 square feet of climbing terrain across them all.
7. Los Angeles-Long Beach-Anaheim
- Region: West
- State: California
- Population: 12,974,487
- Number of Roped Gyms: 16
- Number of Bouldering Gyms: 14
- Square Feet of Climbing: 342,929
- CWDI Score: 14.4
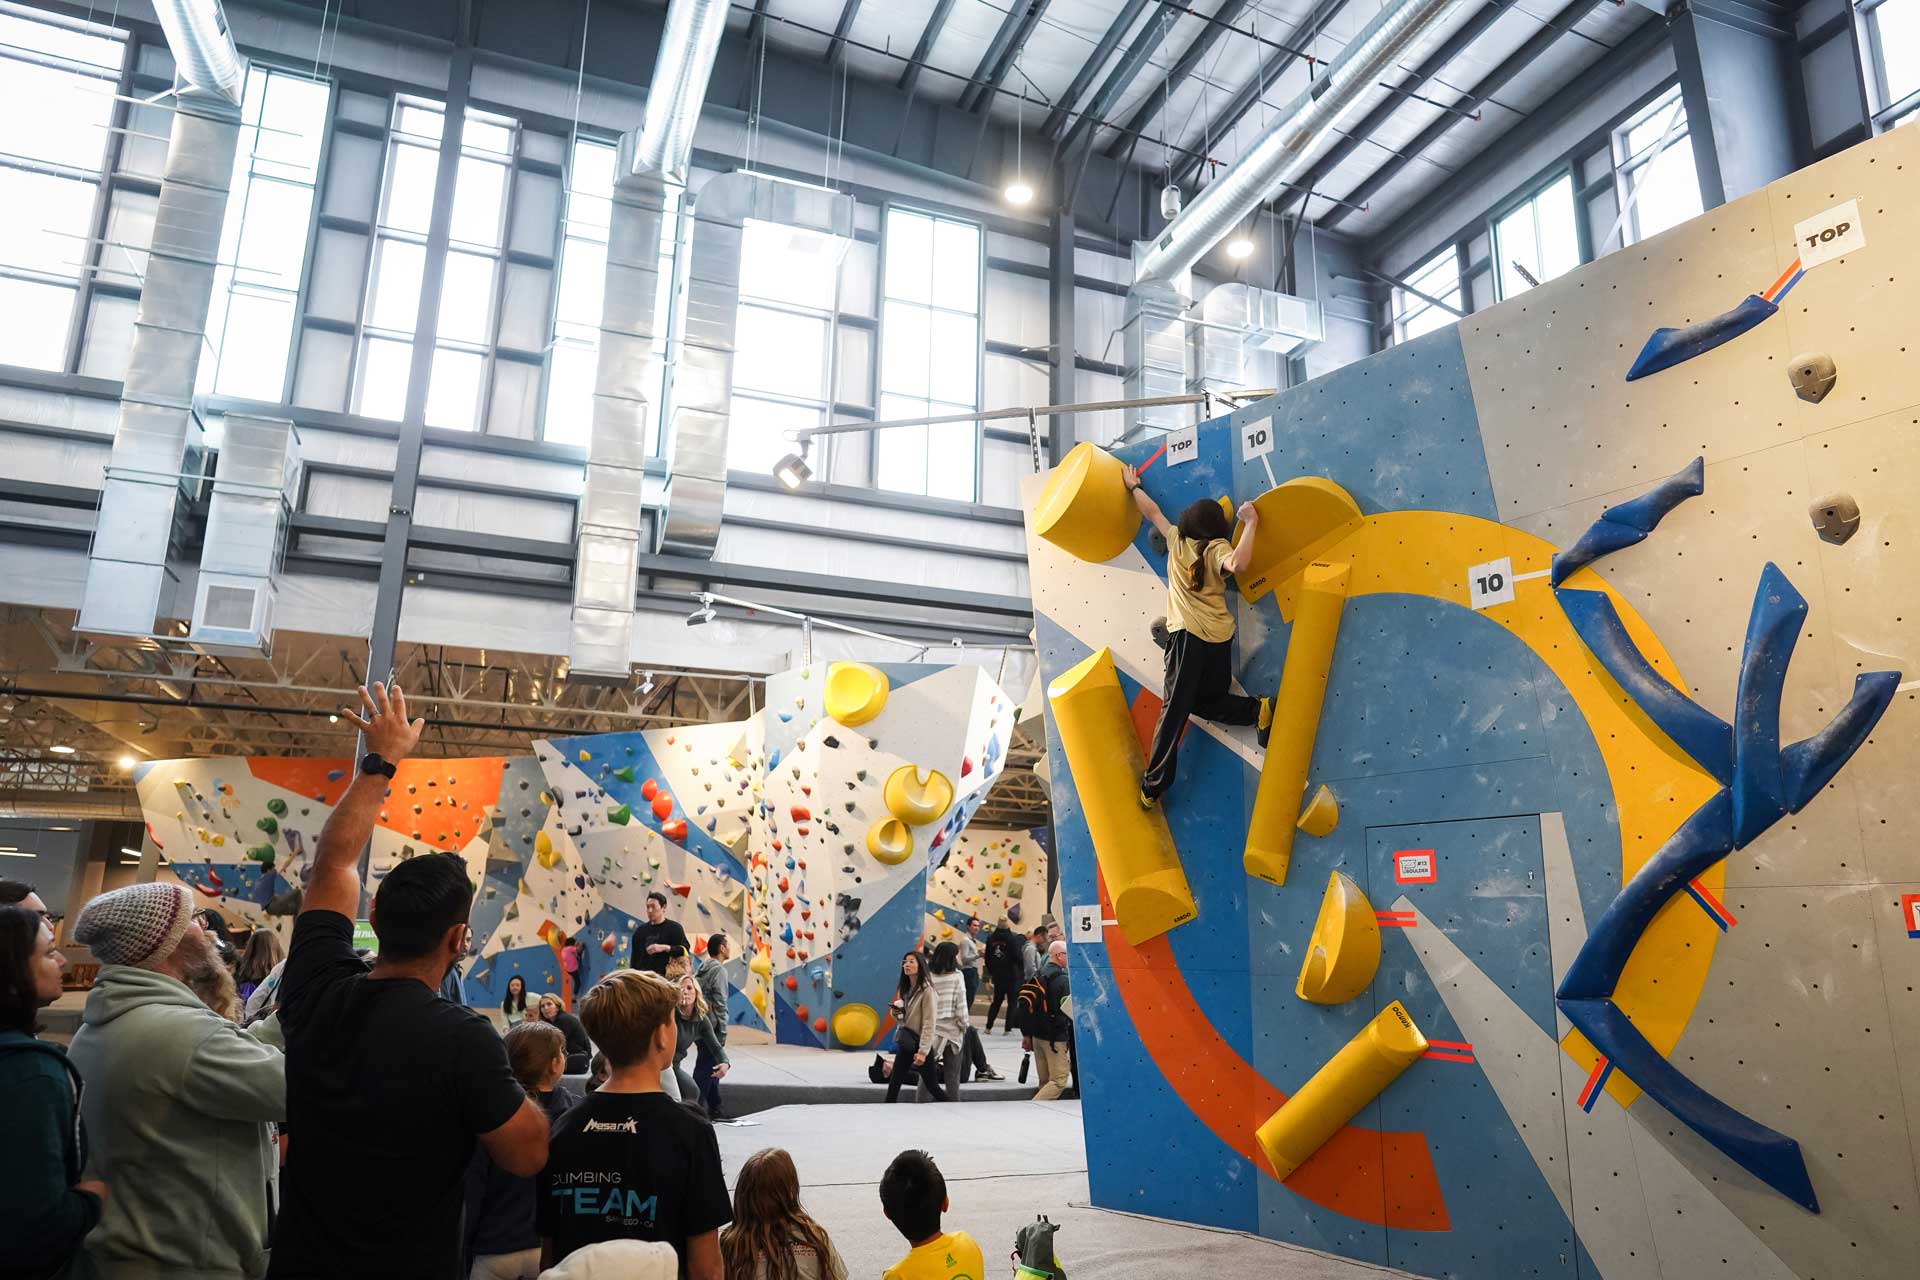
In 7th place is Los Angeles-Long Beach-Anaheim, the metro area with the second-most commercial climbing gyms in the U.S. but also the second-highest population, making it runner-up in California in the CWDI rankings. The first climbing gym in the market—Rock City Climbing Center—opened in 1991 and operated for 30 years before closing in 2021. Today, some of the largest climbing gym developers in the country run multiple facilities in the greater Los Angeles area; Sender One, Touchstone and Hangar 18 each operate six or more. Altogether, gym patrons can climb over 340,000 square feet of wall surface around Los Angeles, as well as access a variety of training, fitness and yoga offerings at gyms of myriad shapes and sizes.
6. New York City-Newark-Jersey City
- Region: Northeast
- State: New York
- Population: 19,798,537
- Number of Roped Gyms: 24
- Number of Bouldering Gyms: 13
- Number of Planned Gyms: 1
- Square Feet of Climbing: 452,927
- CWDI Score: 18.6
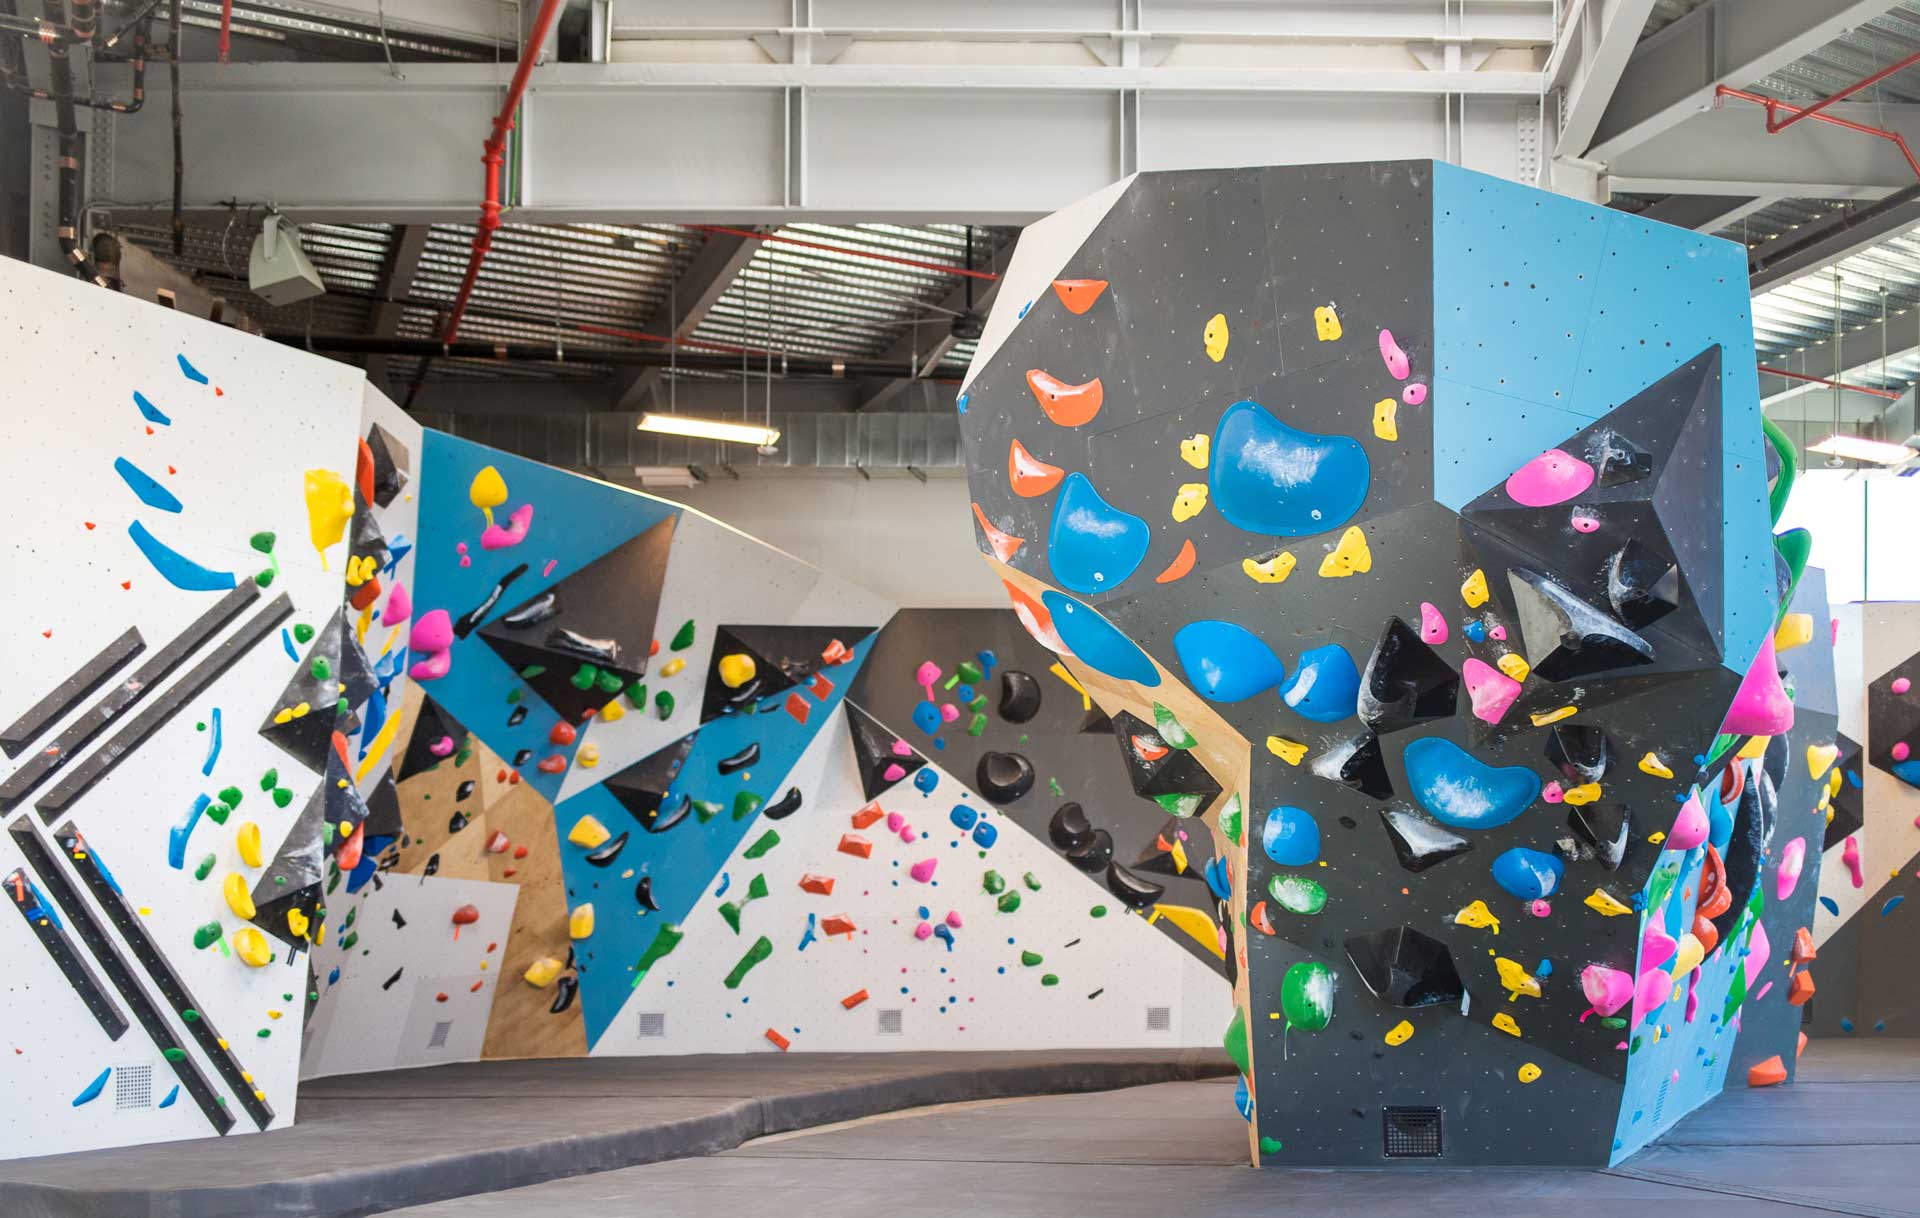
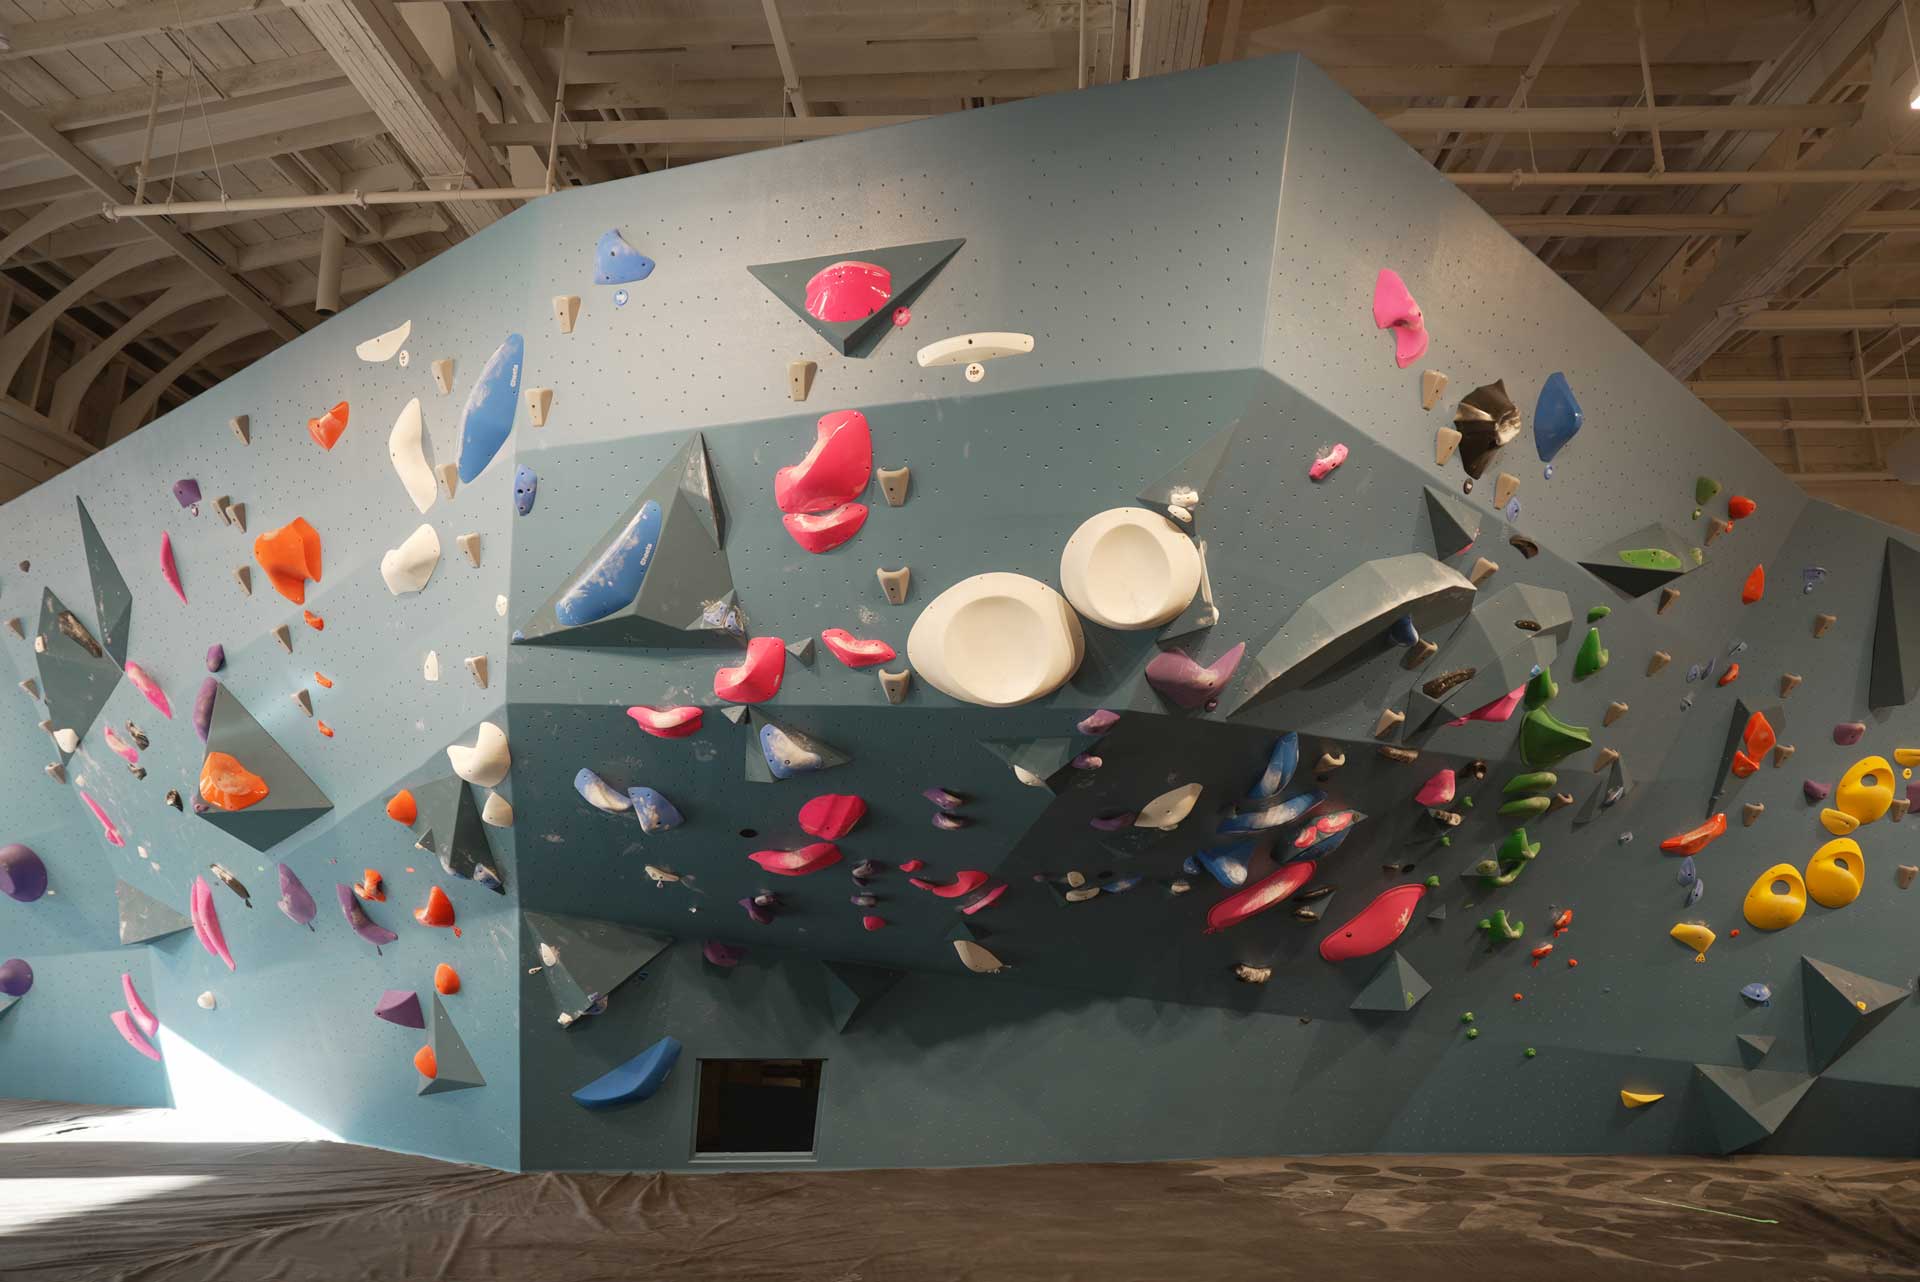
Of all the 900+ metro areas in the U.S., New York City-Newark-Jersey City is the sole one that ranks in the Top 10 in both the CWDI and opportunity score—meaning there’s a high density of commercial climbing in the area already and high likelihood of more to come in the future. Although it has the largest population on this list (about 19.8 million people), it also leads the way in total square feet of commercial climbing (over 450,000 square feet) and commercial climbing gyms (37). The Gravity Vault operates nearly a dozen gyms in the area—11, with a 12th planned for Edison—followed by Movement (4) and VITAL (4). Especially for roped climbing, New York City stands out, with more full-service facilities (24) than any other U.S. market.
5. Seattle-Tacoma-Bellevue
- Region: West
- State: Washington
- Population: 4,061,920
- Number of Roped Gyms: 5
- Number of Bouldering Gyms: 14
- Number of Drytool/Ice Gyms: 1
- Square Feet of Climbing: 189,460
- CWDI Score: 19.2
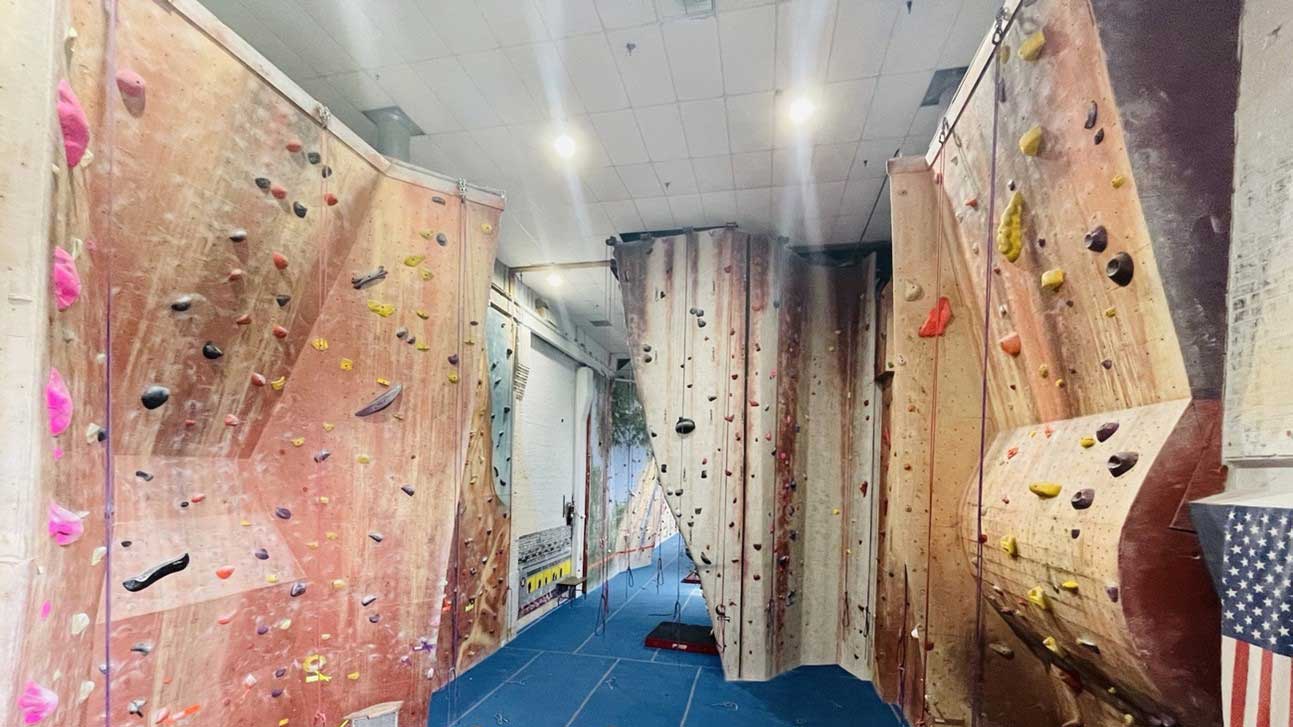
The Seattle-Tacoma-Bellevue metro area is home to the first commercial climbing gym in the U.S. (now named Vertical World). It’s also the market in the Pacific Northwest—which is well known for its outdoor climbing—with the highest density of commercial climbing in the CWDI rankings. There are 20 facilities serving the greater Seattle area, including 14 bouldering-focused gyms—tied with Los Angeles for the most in the country, with a population that’s about three times smaller. From Seattle in the north to Tacoma in the south, climbers can find multiple gyms by Vertical World, Edgeworks and Bouldering Project, one by Momentum, a drytool/ice facility and more—offering over 186,000 square feet of climbing in total.
4. New Haven
- Region: Northeast
- State: Connecticut
- Population: 570,598
- Number of Roped Gyms: 2
- Number of Bouldering Gyms: 2
- Square Feet of Climbing: 28,005
- CWDI Score: 21.4
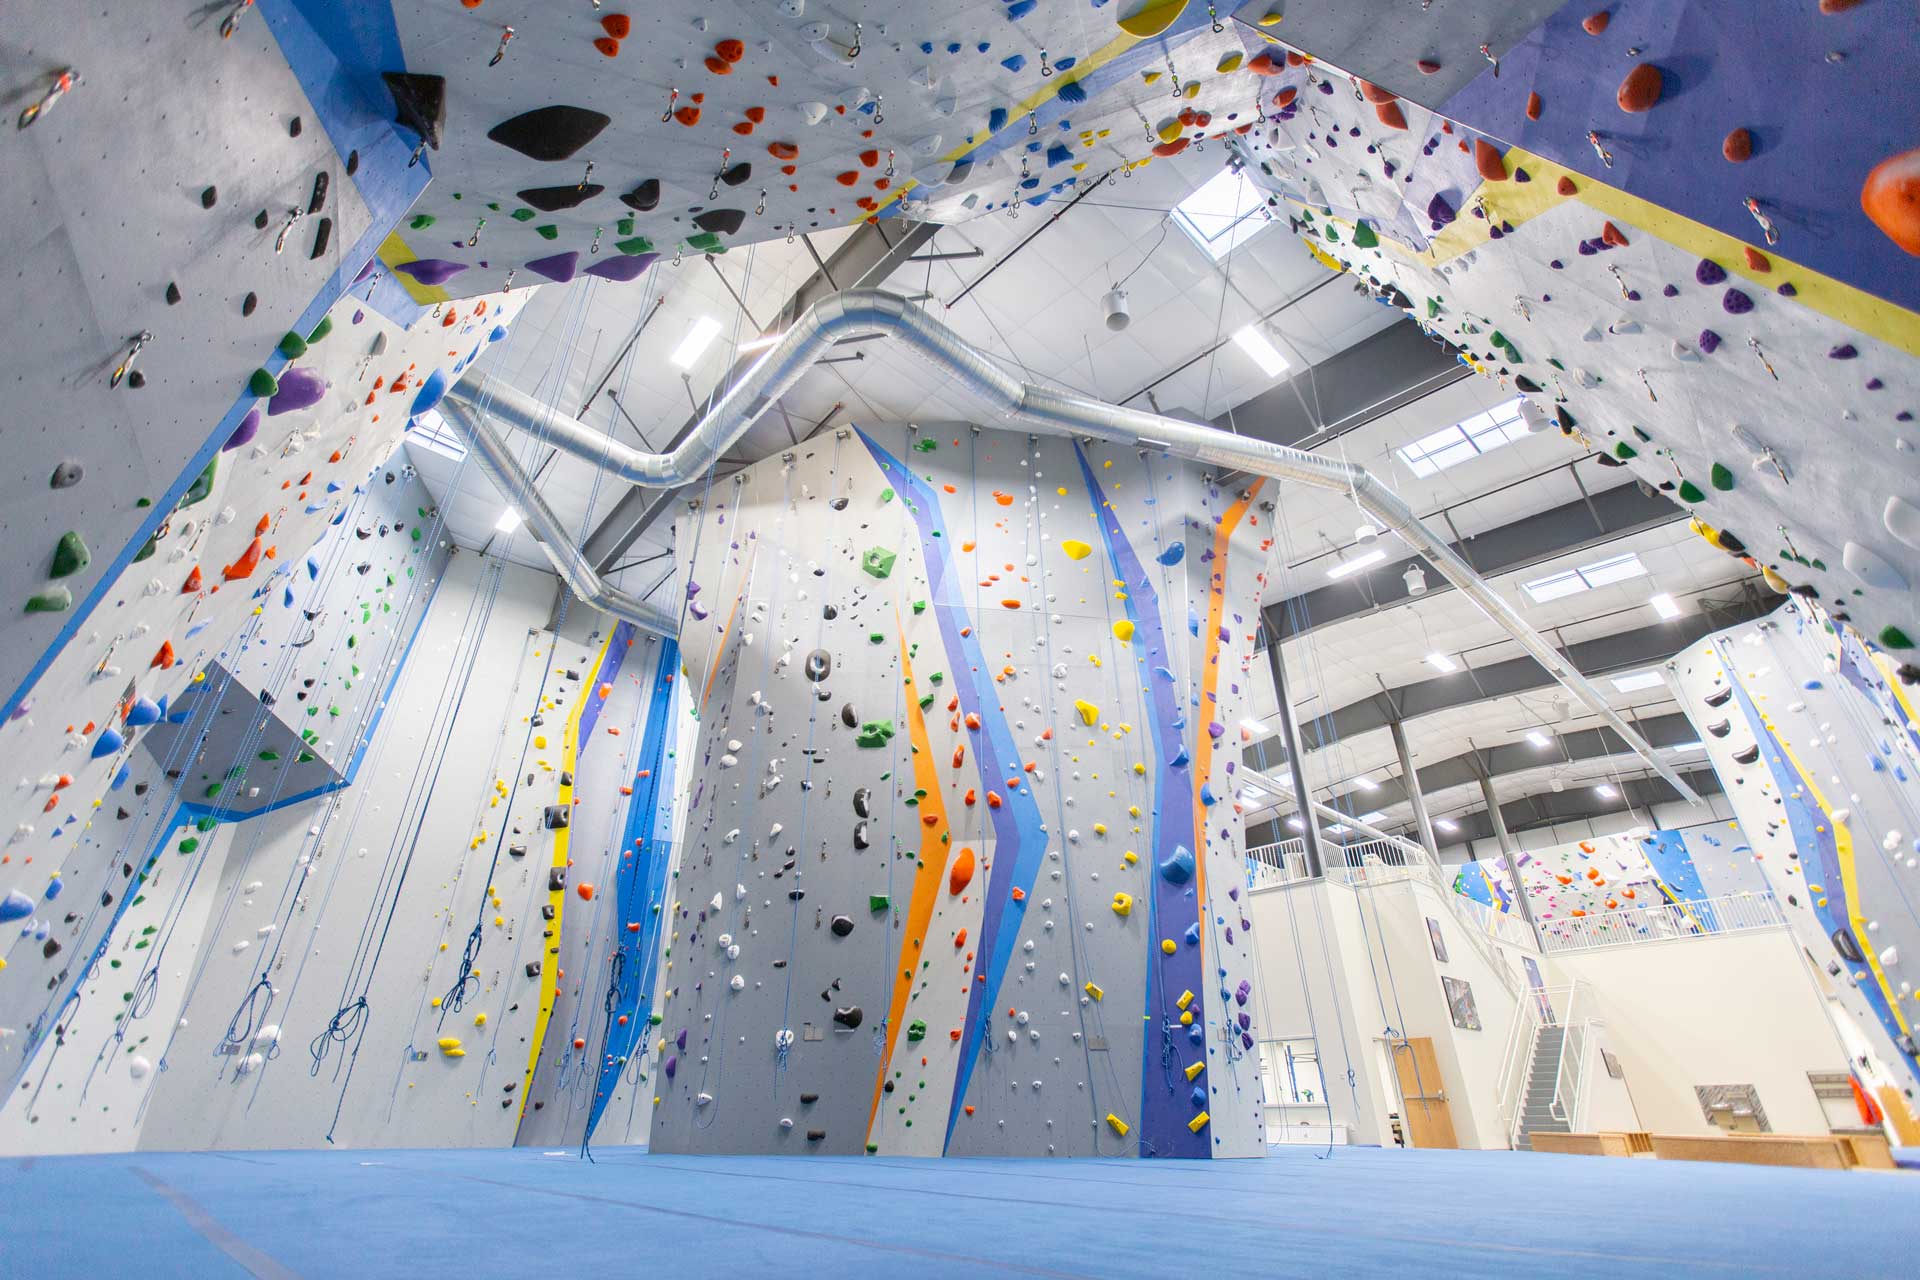
On the other end of the population spectrum, New Haven has about seven times fewer square feet of commercial climbing than the Seattle metro area, but it also has a population that’s about seven times lower, so it’s still dense in indoor climbing relative to its size. The first commercial climbing gym in the market—Prime Climb, now Rock Spot Wallingford—opened in 1993, and three more have been built since then: City Climb (2007), Ascent Climbing Gym and Rock Spot New Haven (2024). With multiple roped and bouldering facilities in a smaller area than many other metros, indoor climbers in New Haven have more square feet of climbing nearby on a per capita basis. In CWDI scores, the market ranks 4th in the U.S. and runner-up in the Northeast.
3. Boston-Cambridge-Newton
- Region: Northeast
- State: Massachusetts
- Population: 4,953,354
- Number of Roped Gyms: 13
- Number of Bouldering Gyms: 10
- Square Feet of Climbing: 237,806
- CWDI Score: 35.4
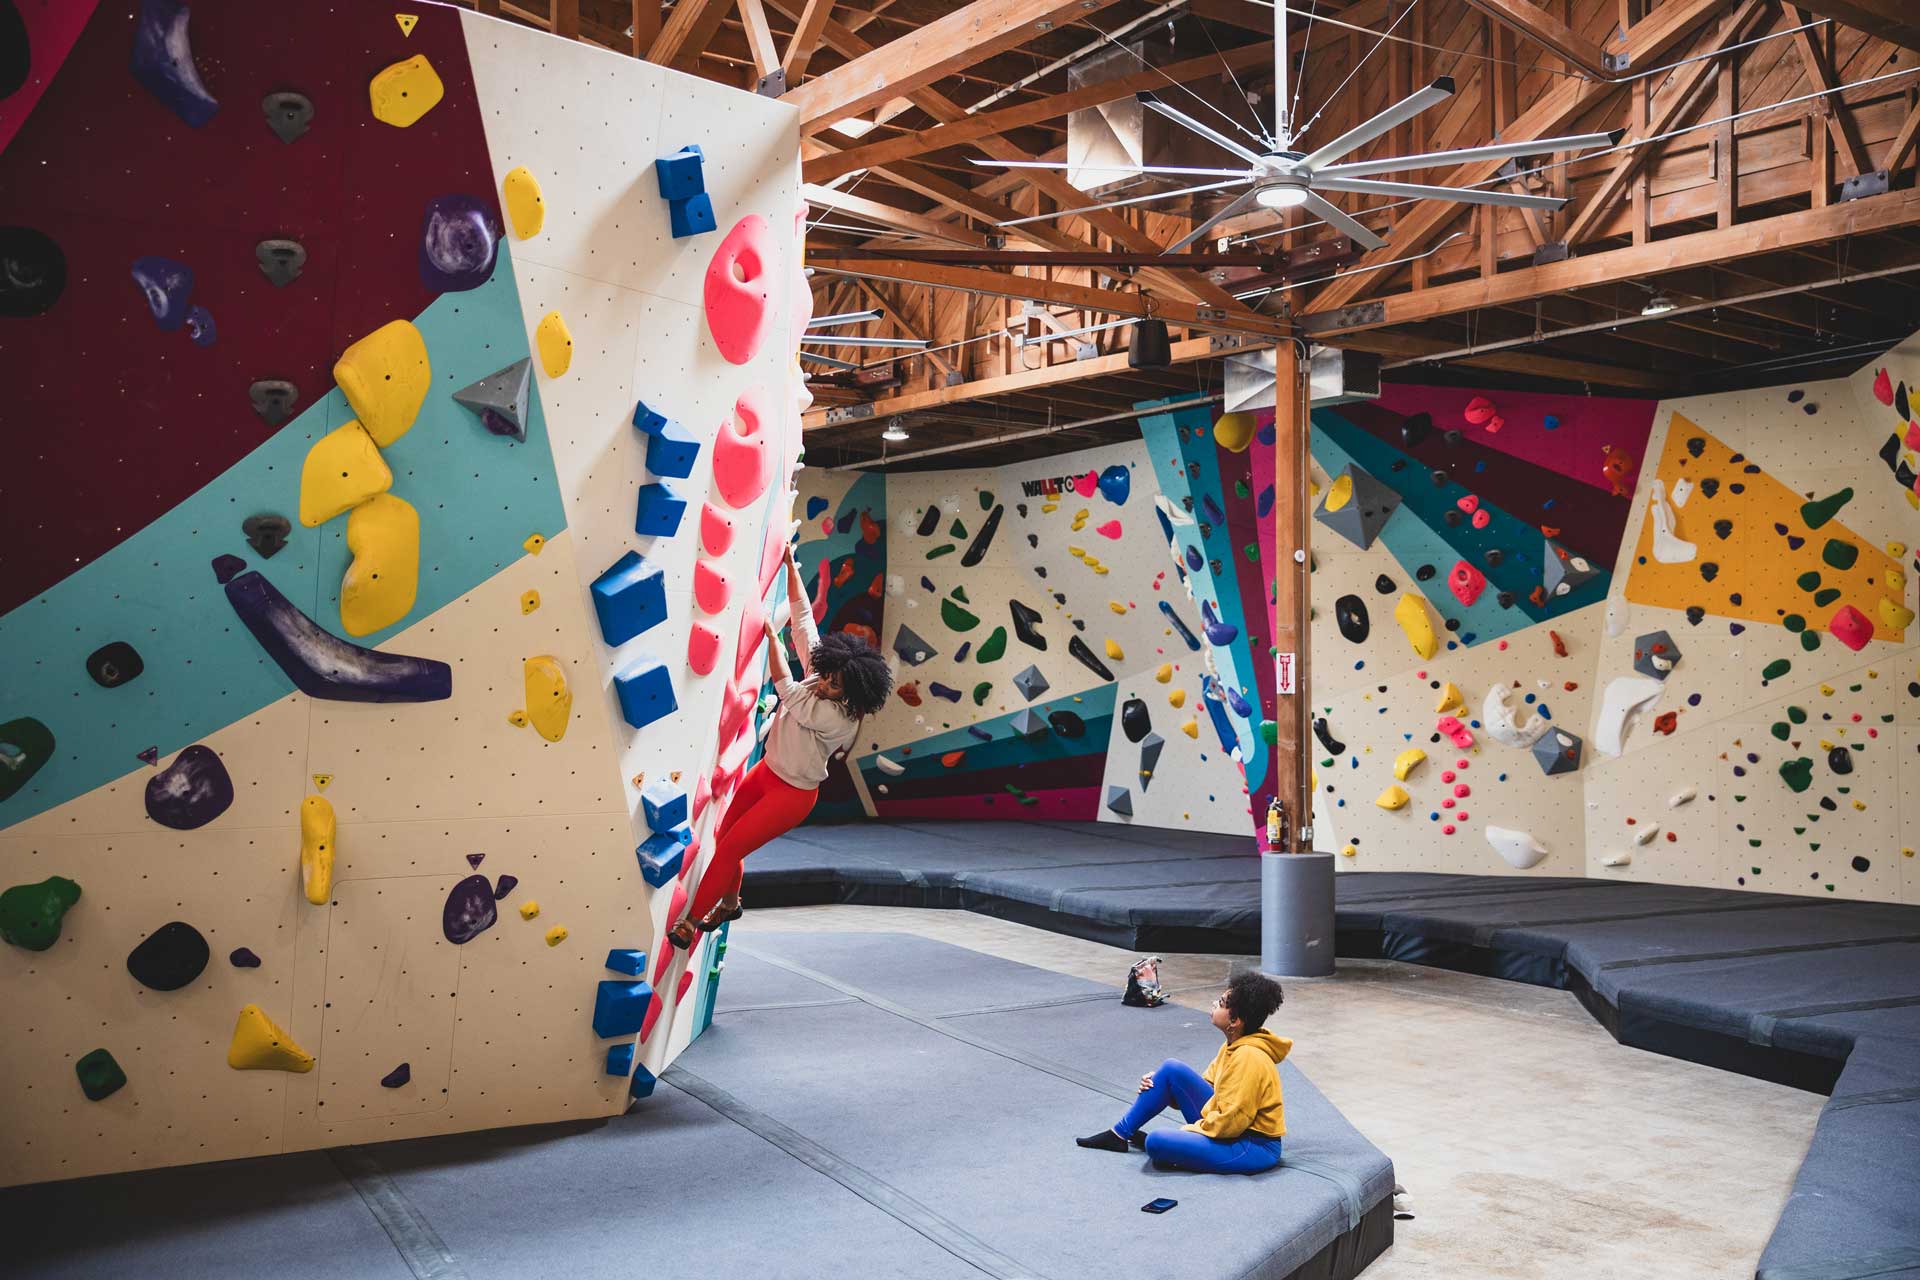
Ranking 3rd in the CWDI is Boston-Cambridge-Newton, with the highest density of commercial climbing in the Northeast. Longtime climbers in the Boston area have been able to climb and train at indoor commercial gyms for over 35 years, since Boston Rock Gym opened in 1989. That gym closed in 2018, but today there are 23 other facilities in the market. Central Rock Gym (9), MetroRock (4) and Rock Spot (4) all operate multiple gyms in the greater Boston area. Combined, the Boston market has over 235,000 square feet of climbing on tap. And with nearly two dozen commercial facilities, there’s a full lineup of additional amenities and programs, from elite competitions to youth teams, fitness classes, gym-to-crag education and more.
2. San Francisco-Oakland-Fremont
- Region: West
- State: California
- Population: 4,645,029
- Number of Roped Gyms: 10
- Number of Bouldering Gyms: 9
- Number of Planned Gyms: 1
- Square Feet of Climbing: 252,088
- CWDI Score: 49.2
On the other side of the country, in 2nd place in commercial climbing density is San Francisco-Oakland-Fremont, with a slightly lower population than the Boston metro area and slightly more square feet of commercial climbing. There are more climbing gyms in California than any other U.S. state, and the greater San Francisco area has 19 of them, plus another (California Climbing Collective) on the way. The oldest of those gyms in the city of San Francisco—Mission Cliffs, Touchstone’s first location—opened in 1995. Since then, multiple developers have expanded the commercial wall surface available in the market, including Touchstone (9 gyms), Movement (2 gyms) and Benchmark (2 gyms). With double-digit roped and bouldering facilities on hand, over 250,000 square feet of wall surface across them, and dedicated gyms for training and kids, San Francisco is the most indoor-climbing-dense area on the West Coast, based on the CWDI.
1. Boulder
- Region: West
- State: Colorado
- Population: 328,961
- Number of Roped Gyms: 3
- Number of Bouldering Gyms: 5
- Number of Drytool/Ice Gyms: 1
- Square Feet of Climbing: 87,893
- CWDI Score: 275.9
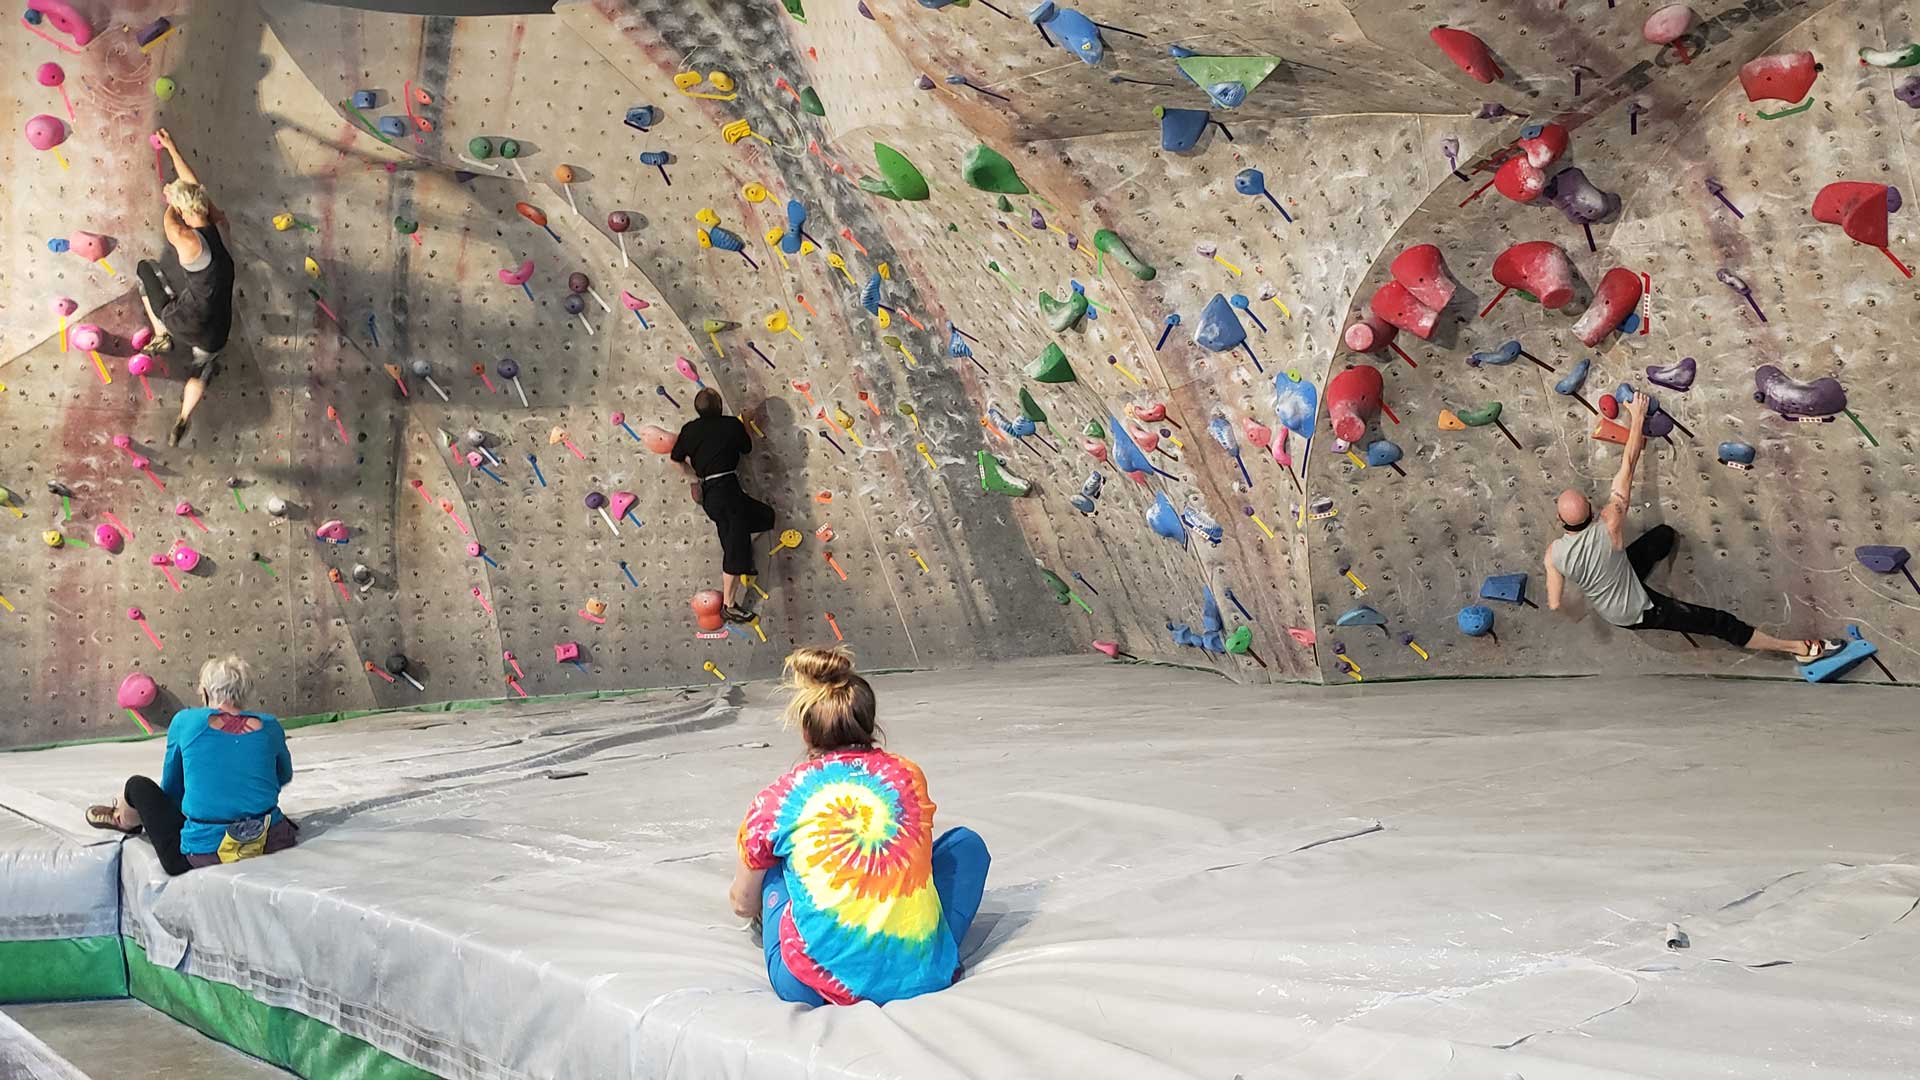
In 1st place, with the highest CWDI in the country, is Boulder, Colorado. Even though the market has the second-lowest population on this list (about 330,000 people) and is smaller in size, it nearly has double-digit commercial climbing gyms (9) and not much less than six-digit square feet of climbing (about 90,000) across those facilities. Like the Fort Collins and Denver metro areas, Boulder has a wealth of outdoor climbing nearby and a longstanding indoor-climbing-gym scene that has developed alongside it. The first commercial climbing gym in Boulder—Boulder Rock Club—opened 35 years ago, in 1991, and the city is also home to The Spot Boulder, which is often regarded as the first bouldering gym in the U.S. Boulders, roped routes, drytool/ice climbing, training boards, comps and events, teams and leagues, classes…indoor climbers can find it all in Boulder—the U.S. city and market with the highest score in commercial climbing density.
Methodology, Limitations & Disclaimer
All the gym data for CBJ’s Climbing Gym Market Report and Dashboard was derived from the comprehensive dataset powering CBJ’s industry-leading Gyms & Trends report and Gym Map. As noted in the introduction, the market data referenced in this article, and throughout the report and dashboard, was primarily derived from the U.S. Census Bureau’s annual American Community Survey (ACS) for the year 2024 and consists of five-year estimates/percentages for U.S. core-based statistical areas (CBSAs).
In addition to the limitations noted in the introduction, another one is that the number of climbing gyms in a market is always a moving target, since there are continually new projects being announced and constructed or existing gyms permanently closing their doors. Like other publications, this article represents a snapshot of a moment in time, referencing data pulled from CBJ’s Gym Map dataset primarily in April 2026, and does not reflect changes after publishing. Furthermore, only commercial climbing gyms in the U.S. were included in the analysis, in part because more robust data was available for these facilities. In the future, information on other sites with a climbing wall and markets in other countries could be completed and analyzed.
Other limitations were the use of square feet of climbing instead of linear feet of climbing, which results in more weight being given to roped gyms with taller walls than bouldering gyms with shorter walls, and the fact that geographical boundaries of CBSAs are not uniformly distributed, which doesn’t account for commercially “empty” space where there is more wilderness and less urbanization. In the future, other ways to weigh the quantity of commercial climbing in a market and factor in the amount of “used” land area could be considered, as more data becomes available.
Finally, please note that content in this article and the CBJ Climbing Gym Market Report and CBJ Climbing Gym Market Dashboard is of a general nature and is for informational purposes only. Readers should not construe any such information or other related materials as legal, tax, investment, financial or other advice. In exchange for accessing this content, the reader agrees not to hold CBJ, its affiliates or any third-party service provider liable for any possible claim for damages arising from any decision you make based on the content.
More details on the methodology, sources and limitations of the analysis (as well as a full legal disclaimer) can be found in the report and dashboard.
Contribute to the Research
Got an idea for how to improve these tools, a question about the data, or a comment to share? We’d love to hear from you! Fill out the short, three-question feedback form here anytime.