It’s a question as old as the climbing gym industry itself: Where do I build a new climbing gym? A go-to resource since it first launched in 2024, CBJ’s one-of-a-kind Climbing Gym Market Report and Dashboard was built to help gym developers answer that very question. The reputable tools provide robust statistics on core-based statistical areas (CBSAs) across the United States, break down the landscape for each one, and highlight opportunities for a new climbing gym build.
The model’s opportunity score, in particular, uses regression analysis to identify where markets may be particularly underserved, incorporating metrics on population sizes, income levels, poverty statistics and more key variables. All the market figures in this article, for example, were derived from the U.S. Census Bureau’s latest 5-year (2020-2024) ACS data for CBSAs.
As with any statistical model, keep in mind there are always limitations, more of which are discussed at the end of this article. The opportunity score does not, for instance, assess how large or small of a gym a market may merit or which business model may best suit the community. Some markets may call for a larger roped facility, while others may only have enough demand to support a smaller bouldering gym, and proper business planning is always needed to determine a suitable project scope. But the opportunity score does reveal, in one quick glance, where higher opportunities for a single new climbing gym may abound at this moment in time, ranking every CBSA in the country.
Without further ado, below are the Top 10 markets with the highest opportunity score in CBJ’s Climbing Gym Market Report and Dashboard. In tandem with this article, more insights from the analysis can be read here, a list of the Top 300 opportunity scores can be found in the report, and the complete rankings for all 925 CBSAs can be accessed via the dashboard.

Access the Tools
- CBJ Premium members get them FREE: Download the report here for FREE and contact us to set up one month of FREE dashboard access!
- CBJ Plus and Pro members can purchase the report here and here ($200 / $300) and contact us for dashboard access ($500/mo / $600/mo).
- If you’re not yet a CBJ member, learn more and enroll here. Every paid level is packed with valuable benefits starting at $150/year.

10 San Luis Obispo-Paso Robles
- Region: West
- State: California
- Population: 281,555
- Per Capita Income: $51,592
- Year of First Gym: 1995
- Number of Roped Gyms: 1
- Number of Bouldering Gyms: 0
- Square Feet of Climbing: 13,000
- Opportunity Score: 2.74
San Luis Obispo-Paso Robles, next to the coast of California, ranks among the top 10 opportunity scores for a second straight year. The metropolitan area—in between Los Angeles and San Francisco—got its first climbing gym back in 1995, when CRUX opened its doors. Since CRUX closed in 2020, The Pad’s San Luis Obispo location has been the sole climbing gym in town. In 2002, The Pad was established in a 400-square-foot, 10-foot-tall self-storage unit by Paul Hatalsky, Julie Workman and Yishai Horowitz, and today it’s led by CEO Kristin Horowitz. The gym and business have evolved and expanded a number of times over the years, and The Pad has operated its current SLO facility since 2017. With a population of more than 280,000 people, there may be room for another build in the area, perhaps further north of San Luis Obispo, in Paso Robles.

9. Santa Rosa-Petaluma
- Region: West
- State: California
- Population: 485,040
- Per Capita Income: $56,640
- Year of First Gym: 1995
- Number of Roped Gyms: 2
- Number of Bouldering Gyms: 0
- Square Feet of Climbing: 24,132
- Opportunity Score: 2.94
Also in California, Santa Rosa-Petaluma—north of San Francisco—has the 9th-highest opportunity score in 2026. Like the others on this list, the metropolitan area has had an indoor climbing gym community for over 30 years, ever since Vertex Climbing Center opened in northern Santa Rosa in 1995. Today, there are two roped climbing gyms serving the area: Vertex and Session Climbing, located closer to downtown. Although the area has twice as many climbing gyms as San Luis Obispo-Paso Robles, it’s also nearly twice as populated, with a population of 485,000+ people, making it a prime candidate for a new build. The city of Petaluma, for instance—south of Santa Rosa—does not yet have a commercial climbing gym.
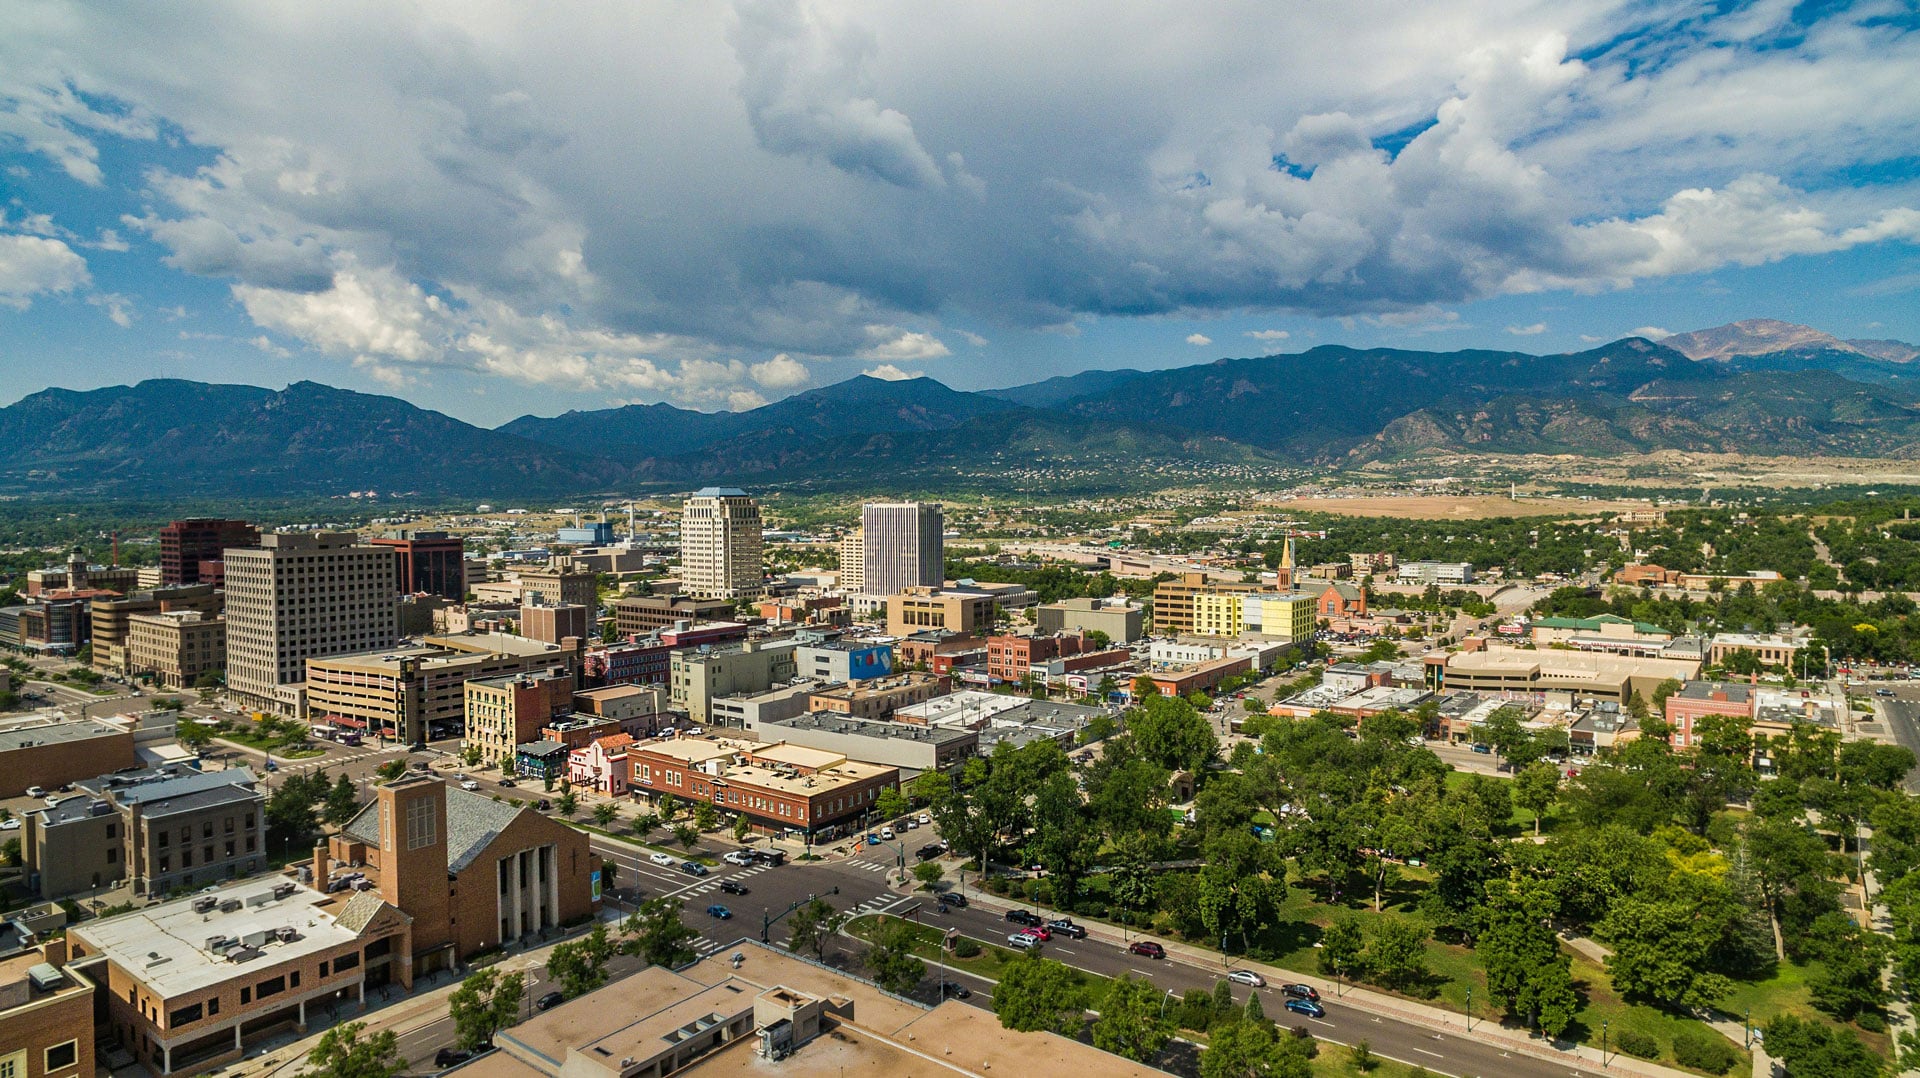
8. Colorado Springs
- Region: West
- State: Colorado
- Population: 767,824
- Per Capita Income: $46,283
- Year of First Gym: 1992
- Number of Roped Gyms: 3
- Number of Bouldering Gyms: 1
- Number of Announced Gyms: 1
- Square Feet of Climbing: 50,500
- Opportunity Score: 3.00
With already some of the most climbing-dense metropolitan areas in the United States—such as Boulder and Denver-Aurora-Centennial—Colorado only has one on this list: Colorado Springs, with the 8th-highest opportunity score in the country. On the Front Range of Colorado, which is considered one of the outdoor climbing meccas of the world, Colorado Springs—south of Denver—already has four indoor climbing gyms in town: CityROCK near the city center; Pure Bouldering further south; Gripstone and Springs Climbing Center further north. But with such a rich history of climbing, there may be space for more climbing gyms in an area with 767,000+ people. CityROCK, for instance, already has plans to help fill that gap with its newly announced North location, which held its groundbreaking ceremony on April 15.

7. Appleton
- Region: Midwest
- State: Wisconsin
- Population: 245,768
- Per Capita Income: $46,727
- Year of First Gym: 1995
- Number of Roped Gyms: 1
- Number of Bouldering Gyms: 0
- Square Feet of Climbing: 12,400
- Opportunity Score: 3.05
Of all the metropolitan areas in the Midwest, Appleton comes away with the highest opportunity score for a second straight year, ranking 7th in the United States. Although it has the second-lowest population among the top 10 on this list and has a much different climbing history than markets out West, the Wisconsin city—south of Green Bay—has still had an indoor climbing scene since the ‘90s. Vertical Stronghold served the area from 1995 to 2006, but there had been a 19-year gap without a gym in town, until Odyssey Climbing + Fitness opened last year. Still, with lower poverty metrics—96.5% of the market’s housing units are occupied, for instance, which ranks second in the entire U.S.—Appleton may have room to welcome another climbing gym.

6. Santa Cruz-Watsonville
- Region: West
- State: California
- Population: 264,926
- Per Capita Income: $56,941
- Year of First Gym: 1993
- Number of Roped Gyms: 1
- Number of Bouldering Gyms: 1
- Square Feet of Climbing: 18,000
- Opportunity Score: 3.10
Santa Cruz-Watsonville has the 6th-highest opportunity score in 2026. Along the Monterey Bay of California—south of San Jose—the metropolitan area has a storied climbing history, being the birthplace of famed climber Chris Sharma, for example. The first climbing gym in town—Pacific Edge—has been in operation for 33 years, as well, and in 2021 the area gained its first bouldering-focused facility, Agility Boulders. Even with a population under 265,000 people, a longstanding climbing legacy coupled with positive economic indicators—the market’s per capita income of $56,941 ranks 23rd in the country—means the area could potentially support a third climbing hub. The city of Watsonville, for example, is still awaiting its first commercial climbing gym.

5. Santa Fe
- Region: West
- State: New Mexico
- Population: 156,105
- Per Capita Income: $52,207
- Year of First Gym: 1990
- Number of Roped Gyms: 1
- Number of Bouldering Gyms: 0
- Square Feet of Climbing: 6,000
- Opportunity Score: 3.22
Ranking 5th this year in opportunity score is Santa Fe, in New Mexico. The state’s capital may have the lowest population on this list, but incomes in the city have been growing (over 10% increase in per capita income when comparing 2015-2019 to 2020-2024), and its $52,207 per capita income ranks 46th in the United States. It’s also had a commercial climbing gym longer than all but one metropolitan area on this list. Santa Fe Climbing Center, which first opened in 1990 and moved to its current location in 2016, has been helping grow the city’s climbing community for 36 years. But with only 6,000 square feet of commercial climbing in town, there may be space for, say, a boutique bouldering hub to complement the roped climbing offerings already on hand.

4. Austin-Round Rock-San Marcos
- Region: South
- State: Texas
- Population: 2,426,592
- Per Capita Income: $56,313
- Year of First Gym: 1989
- Number of Roped Gyms: 3
- Number of Bouldering Gyms: 5
- Number of Planned Gyms: 1
- Square Feet of Climbing: 120,820
- Opportunity Score: 4.14
On the other end of the population spectrum, Austin-Round Rock-San Marcos—the top-ranked metropolitan area in Texas—has the second-highest population on this list, with over 2.4 million people. But it also has about 20 times as much square feet of commercial climbing than Santa Fe spread across eight facilities, following the opening of Crux Climbing Center’s South Austin location this year, with a ninth facility (Lake Travis Bouldering) on the way. Still, with such a large population and high per capita income in the Austin area (26th in the U.S.) that have both been soaring upward (nearly 15% from 2015-2019 to 2020-2024), the capital of Texas likely has room for another climbing gym build (and then some) between Round Rock, to the north, and San Marcos, to the south.
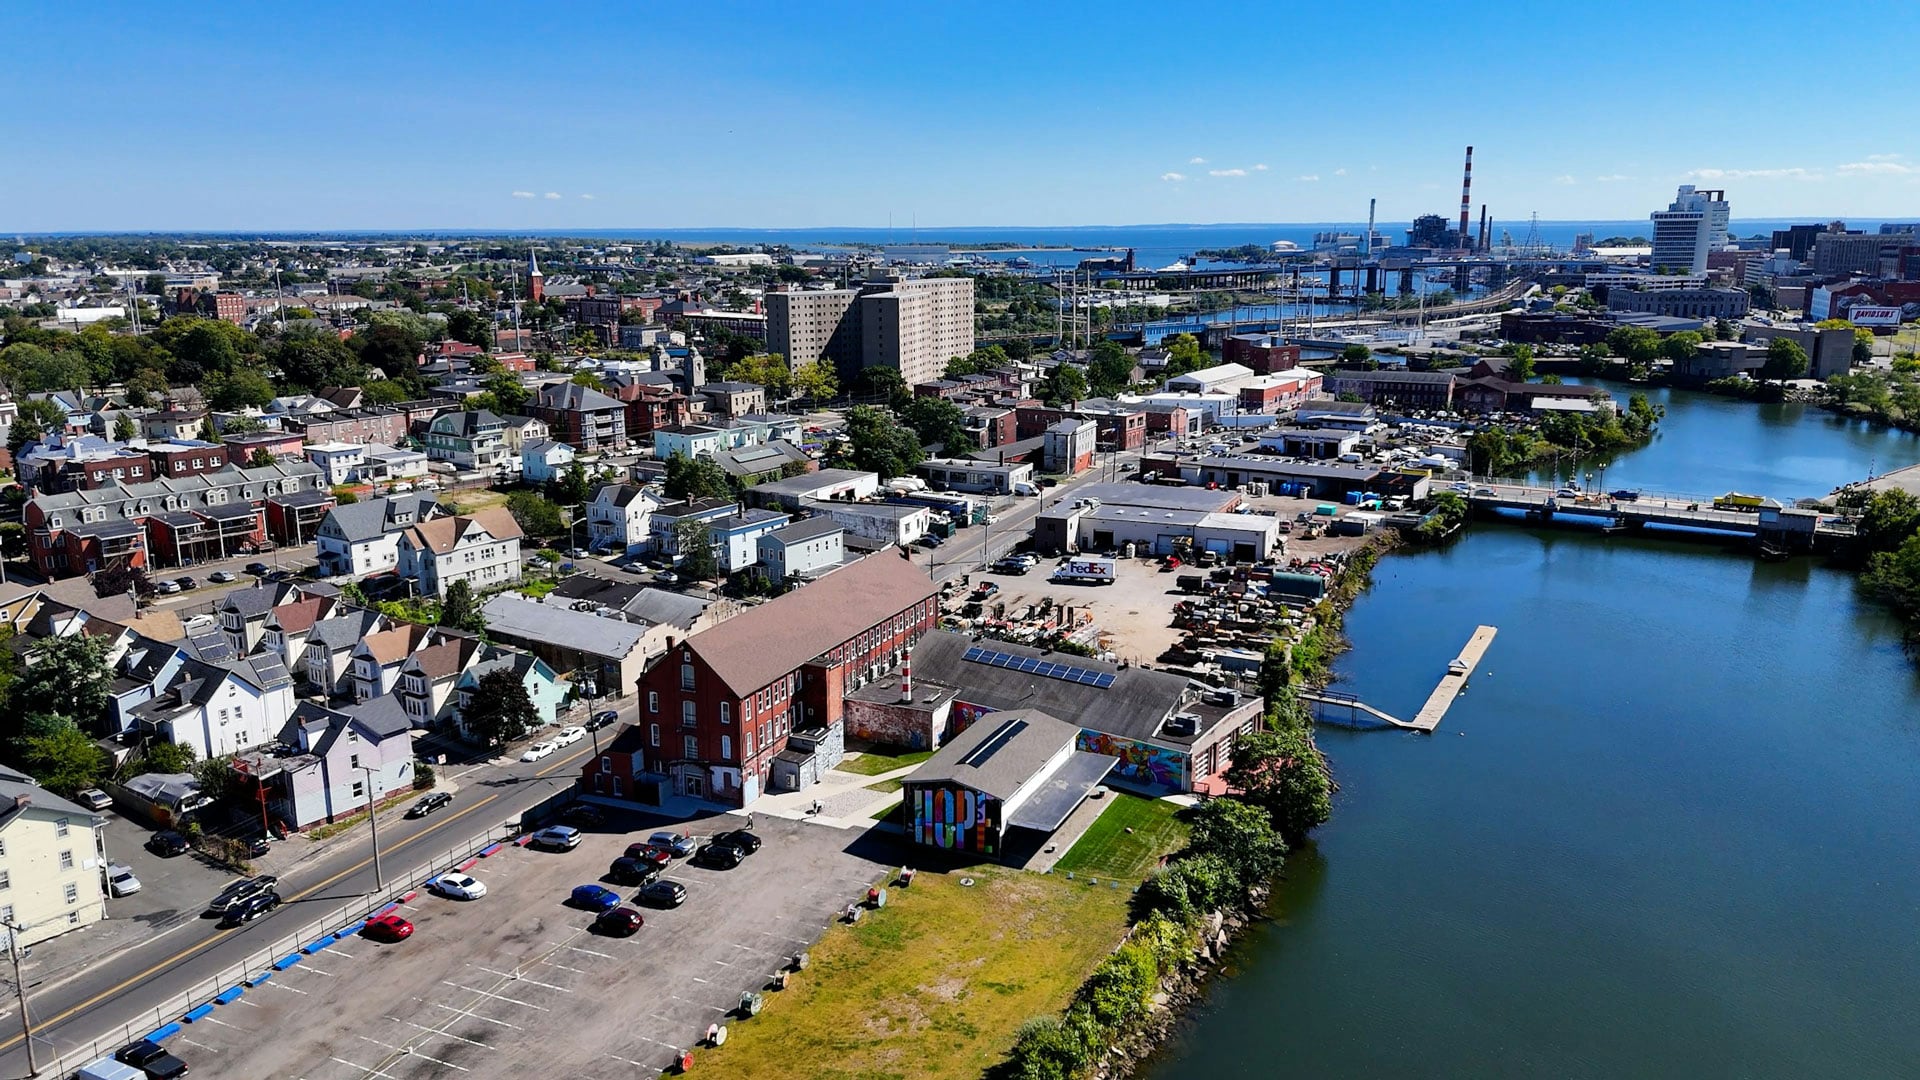
3. Bridgeport-Stamford-Danbury
- Region: Northeast
- State: Connecticut
- Population: 956,330
- Per Capita Income: $71,978
- Year of First Gym: 1994
- Number of Roped Gyms: 1
- Number of Bouldering Gyms: 0
- Square Feet of Climbing: 20,000
- Opportunity Score: 5.49
Bridgeport-Stamford-Danbury, in Connecticut along the Long Island Sound, has the 3rd-highest opportunity score in the United States. Like the other markets in the top four on this list, the metropolitan area has a population that’s over 950,000 people. Yet ever since Beta Climbing closed in 2023, Carabiner’s Rock Climb Fairfield location has been the sole commercial climbing gym in an area with plenty of positive indicators. The market has multiple low poverty metrics ranking in the 90th percentile in the U.S., and its $71,978 per capita income is the 7th-highest in the country. Plus, commercial climbing first started being developed in the area over 30 years ago (Go Vertical’s Stamford location operated from 1994 to 2004). All those factors suggest there’s room for at least one new build within the triangle of Bridgeport, Stamford and Danbury, if not more.

2. San Jose-Sunnyvale-Santa Clara
- Region: West
- State: California
- Population: 1,969,337
- Per Capita Income: $79,109
- Year of First Gym: 1994
- Number of Roped Gyms: 2
- Number of Bouldering Gyms: 2
- Square Feet of Climbing: 55,146
- Opportunity Score: 6.04
There are more markets out West on this Top 10 list than any other region, and 14 markets in the West that have a Top 25 opportunity score, but San Jose-Sunnyvale-Santa Clara tops them all. With nearly 2 million people in the California metropolitan area, the 2nd-highest per capita income in the U.S. (approaching $80,000), and some poverty metrics that are even lower than Bridgeport-Stamford-Danbury’s, it’s easy to see why the market could hold more climbing gyms. Currently, there are four commercial facilities around San Jose, and all but one—Touchstone’s The Studio location—are operated by Movement (Sunnyvale, Santa Clara, Mountain View). Before moving to its current location, the original Santa Clara gym—operated by Planet Granite—served the area from 1994 to 2006, meaning there’s been a commercial climbing community in town for 32 years. Given the high population, strong economic metrics and long climbing legacy, there’s likely space for another climbing gym (or more) in the market.

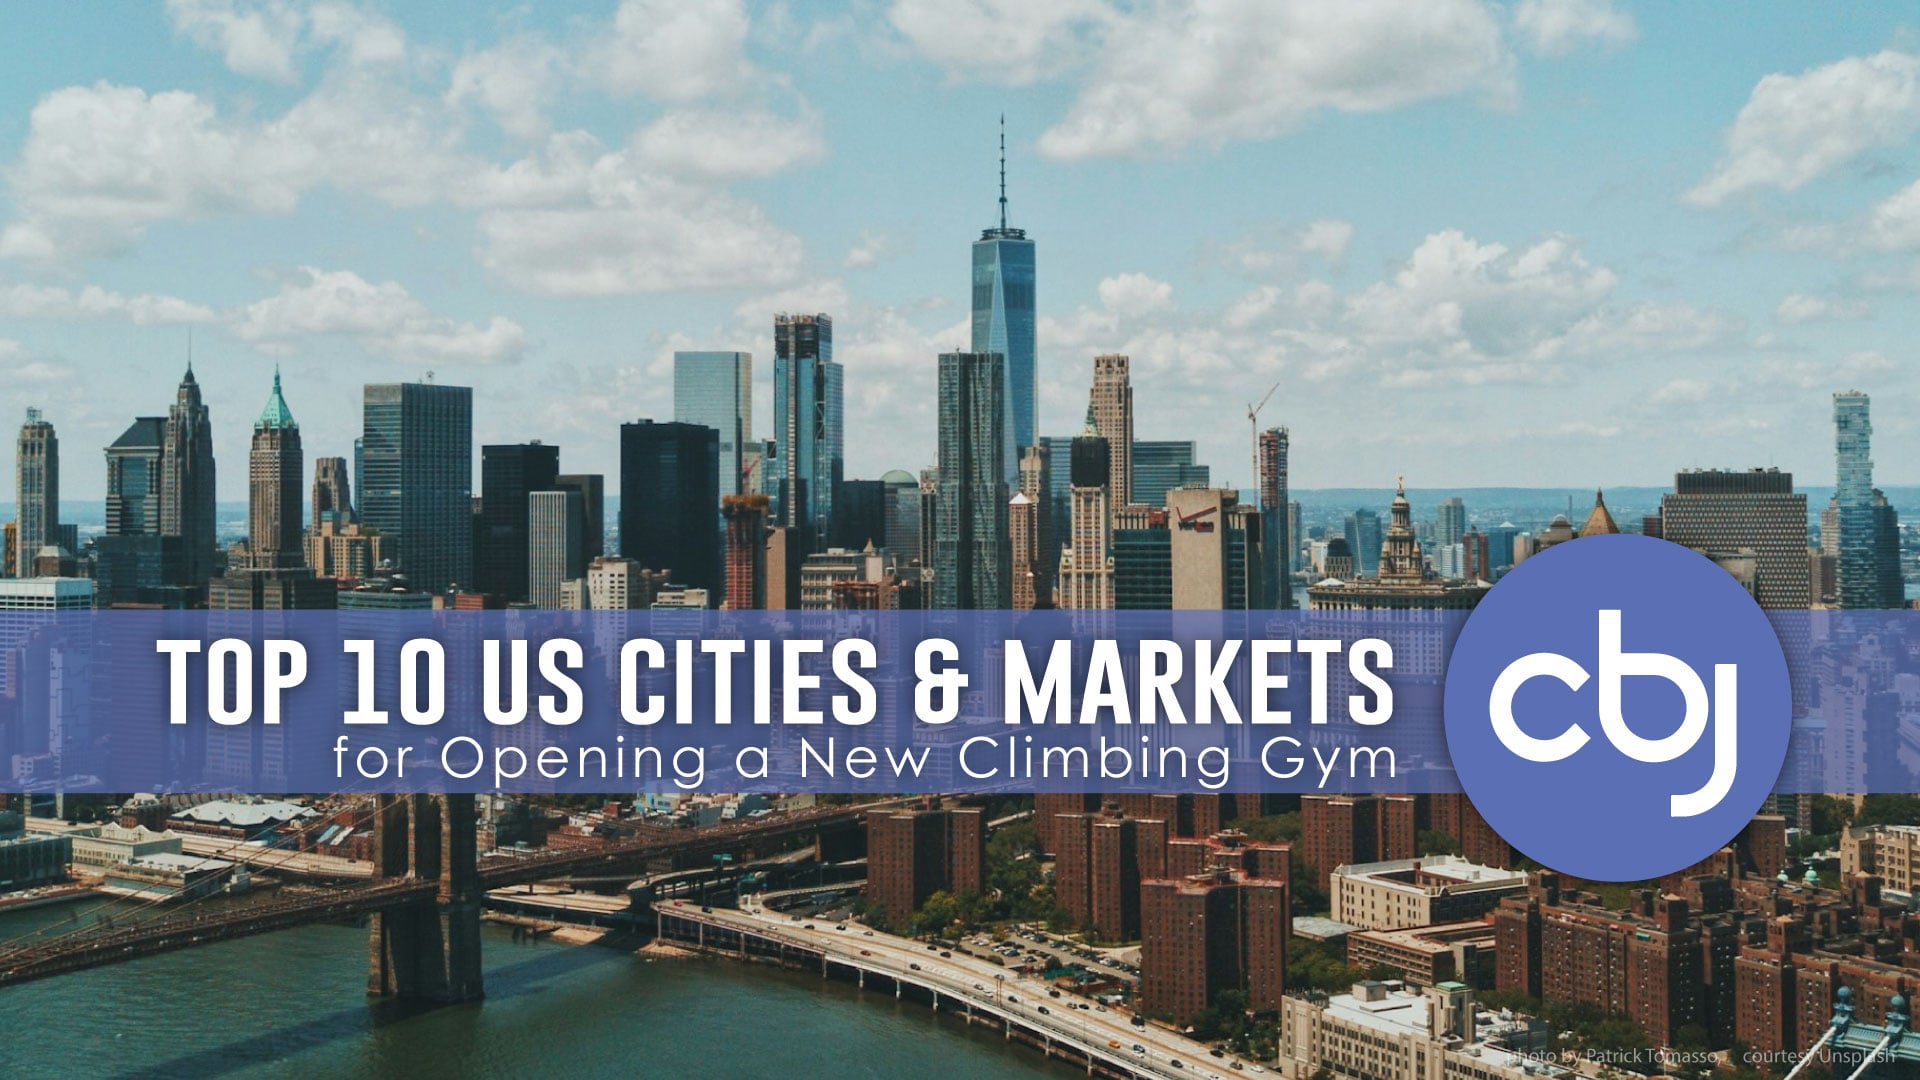
1. New York-Newark-Jersey City
- Region: Northeast
- States: New York, New Jersey
- Population: 19,798,537
- Per Capita Income: $55,691
- Year of First Gym: 1992
- Number of Roped Gyms: 25
- Number of Bouldering Gyms: 12
- Number of Planned Gyms: 2
- Square Feet of Climbing: 457,927
- Opportunity Score: 16.82
Far and away, of all the 925 core-based statistical areas in the United States, the New York City market (New York-Newark-Jersey City) scores #1 in opportunity for a new climbing gym build, based on this model. Even though the market will already have about 458,000 square feet of climbing across nearly 40 gyms, once The Gravity Vault’s Edison location and Rocksteady open their doors, the market’s underlying numbers indicate it’s likely far from tapped out. Primarily, the metropolitan area’s population of almost 19.8 million people is more than 50% higher than the next most populous market in the U.S. (Los Angeles-Long Beach-Anaheim), and its per capita income ($55,691) ranks 29th in the country, for example. Commercial climbing in the area has also been around for 34 years, since the Manhattan Plaza Club Climbing Wall first opened for business. With a longstanding climbing gym community that’s been cultivated over decades and such a large population, New York City and the surrounding cities may see much more development in the years to come.
Methodology, Limitations & Disclaimer
All the gym data for CBJ’s Climbing Gym Market Report and Dashboard was derived from the comprehensive dataset powering CBJ’s industry-leading Gyms & Trends report and Gym Map. As noted in the introduction, the market data referenced in this article, and throughout the report and dashboard, was primarily derived from the U.S. Census Bureau’s annual American Community Survey (ACS) for the year 2024 and consists of five-year estimates/percentages for U.S. core-based statistical areas (CBSAs).
In addition to the limitations noted in the introduction, another one is that the number of climbing gyms in a market is always a moving target, since there are continually new projects being announced and constructed or existing gyms permanently closing their doors. Like other publications, this article represents a snapshot of a moment in time, referencing data pulled from CBJ’s Gym Map dataset in April 2026, and does not reflect later changes. Furthermore, only commercial climbing gyms in the U.S. were included in the analysis, in part because more robust data was available for these facilities. In the future, information on other sites with a climbing wall and markets in other countries could be completed and analyzed.

Additionally, in breaking down climbing gyms by their respective CBSAs, one drawback is that all climbing gyms in a CBSA are associated with the same socioeconomic and health data, regardless of where a climbing gym is located within that market. There are limitations to any regression-based approach, as well, including the type of regression model chosen and missing explanatory variables, which can impact the significance of the selected variables and opportunity score results. In the future, the analysis could leverage alternative statistical models for the opportunity score ranking, incorporate demographic data based on smaller market segments and travel time isochrones, and be broken down into roped and bouldering gyms.
Finally, please note that content in this article and the CBJ Climbing Gym Market Report and CBJ Climbing Gym Market Dashboard is of a general nature and is for informational purposes only. Readers should not construe any such information or other related materials as legal, tax, investment, financial or other advice. In exchange for accessing this content, the reader agrees not to hold CBJ, its affiliates or any third-party service provider liable for any possible claim for damages arising from any decision you make based on the content.
More details on the methodology, sources and limitations of the analysis (as well as a full legal disclaimer) can be found in the report and dashboard.
Contribute to the Research
Got an idea for how to improve these tools, a question about the data, or a comment to share? We’d love to hear from you! Fill out the short, three-question feedback form here anytime.