It’s a question we’ve likely all wondered at some point: How much compensation are other professionals in the climbing gym industry earning or paying?
Climbing Business Journal released a survey last November to help with answering that very question, and now you can access the results. We sincerely hope this information helps all parties foster a more equitable workplace.
Below are five high-level takeaways the CBJ team had after crunching the numbers submitted by 888 employees working in all corners of the industry, and the full methodology behind the analysis can be found at the end of this article.
For the complete survey results, be sure to check out CBJ’s brand-new Climbing Gym Staff Compensation Dashboard. The dynamic dashboard empowers you to go even deeper into the data, with over 30 pages of interactive visuals and filters, including:
- Hourly wages and annual salaries adjusted for cost of living and broken down by employee and climbing gym characteristics, market factors, and job roles.
- The ability to look up and enter your own cost of living index to see what an equivalent hourly wage or annual salary would be in your area or country, based on the survey analysis.
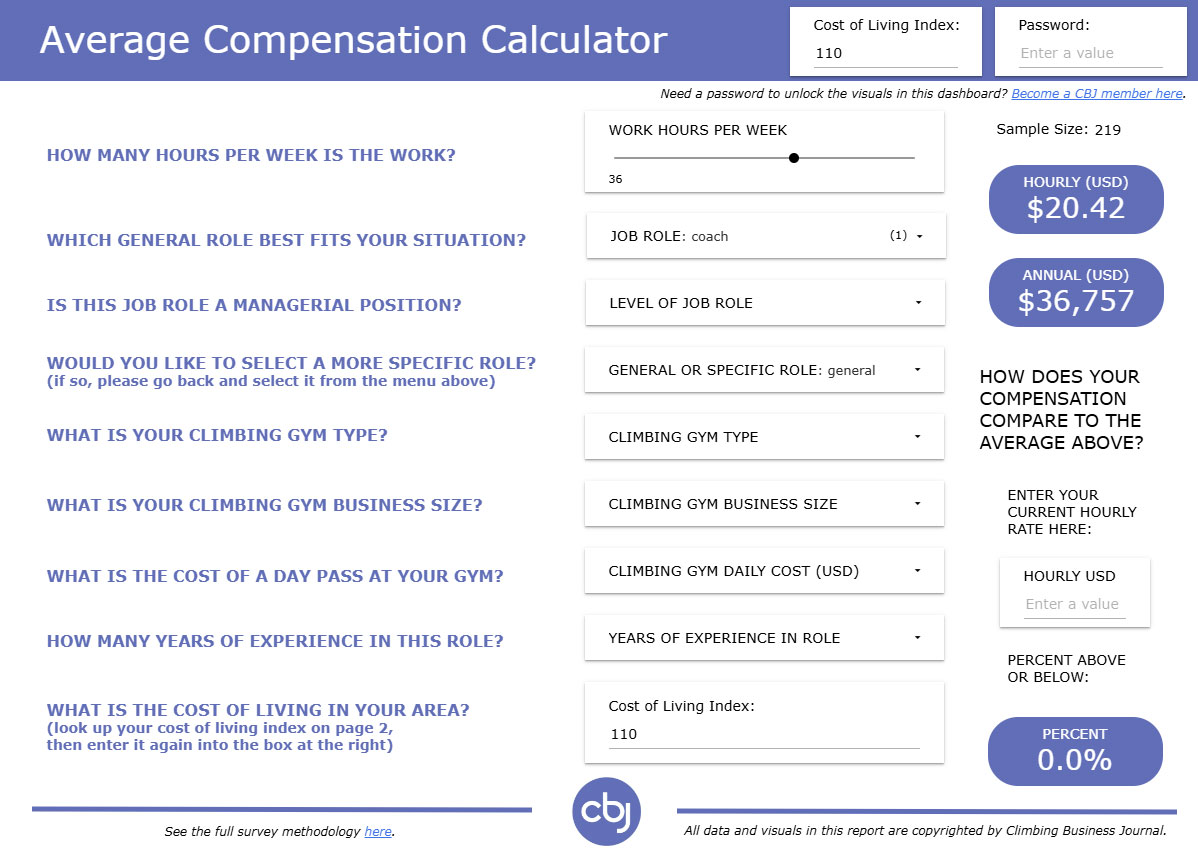
- An average compensation calculator, so you can quickly calculate survey-wide averages for a particular job situation and make comparisons, incorporating multiple key variables.
- Insights on benefits—medical/dental/vision insurance, wellness benefits, professional development reimbursements, etc.—as well as job satisfaction figures and trends.
- Deep dives into compensation stats for specific job roles in gym management, routesetting, coaching, instruction, programming, front desk, marketing and maintenance.

Experience the Dashboard
Want to access the dashboard?
- Took the survey? We sent you an email with a password to unlock the visuals and view them for FREE for one month (please reach out here if not). We also sent you a coupon for $10 off any new membership.
- CBJ member at any paid level? When you are logged in, you will see the dashboard. Thanks for being a member!
- Not yet a CBJ member yet? It’s time to join! Every paid level is packed with valuable benefits starting at $30/year – learn more and enroll here.
Takeaways From CBJ’s Compensation Survey
Without further ado, here are five takeaways from CBJ’s Climbing Gym Staff Compensation Survey. Special thanks to Expensive Boulders for partnering with us to help spread the word, and thank you to everyone who took the survey and made this analysis possible! Serving you—the businesses, professionals and climbers in the industry—is why we do this work.

Takeaway #1: The industry has come a long way from the early days
Since the first commercial climbing gyms opened roughly 40 years ago, operating a climbing gym business has blossomed into a robust, sophisticated industry. There are now over 875 climbing gyms in North America alone according to CBJ’s latest Gyms & Trends report and dashboard, providing meaningful jobs to tens of thousands of employees over the years. That growth is evident in CBJ’s Climbing Gym Staff Compensation Dashboard.
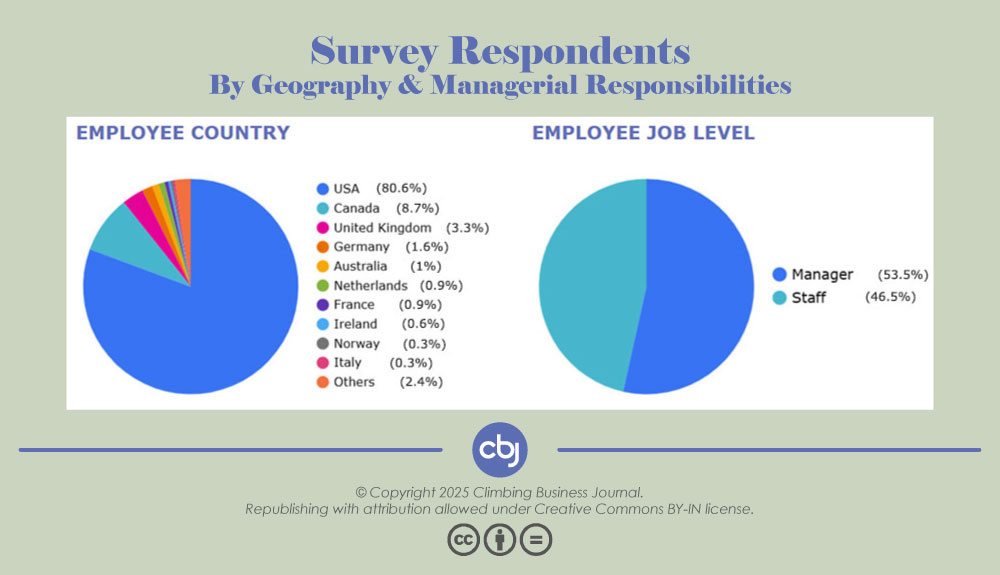
Altogether, across the 888 employees who took the survey—spanning more than two dozen countries (81% in the United States)—the average hourly wage was about $23 per hour, in U.S. dollars (the currency used throughout this report and the dashboard), and among employees in the U.S. the average was $23.88. That latter figure is roughly 36% more than the highest state minimum wage in the U.S. ($17.50 in Washington D.C.) reported by the U.S. Department of Labor. (All facilities represented in the survey, of course, were compliant with their area’s minimum wage.)
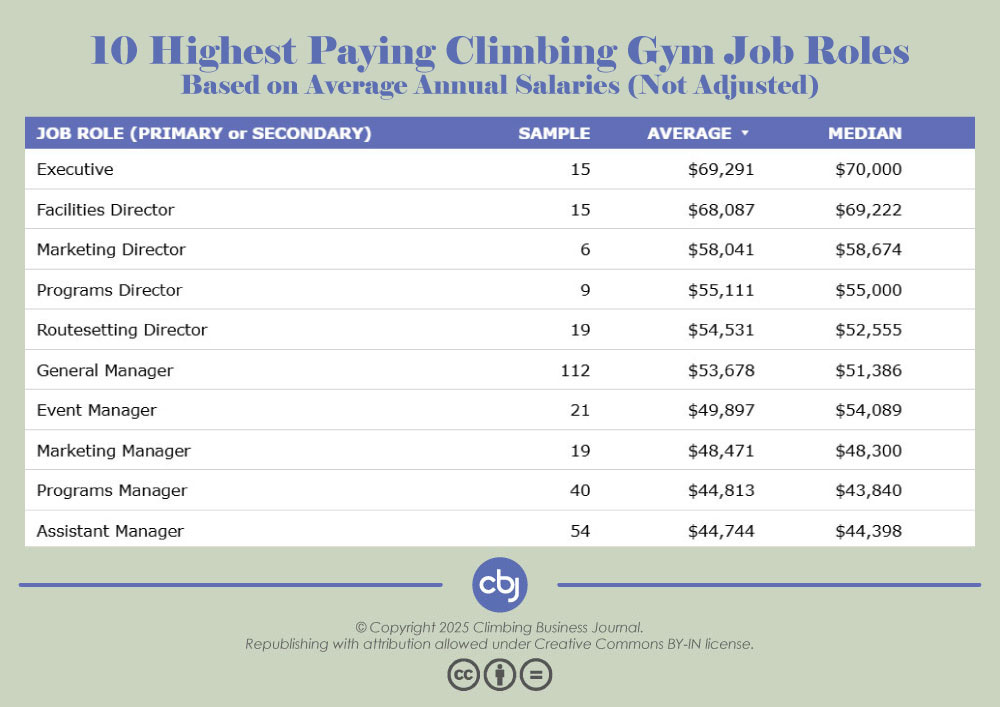
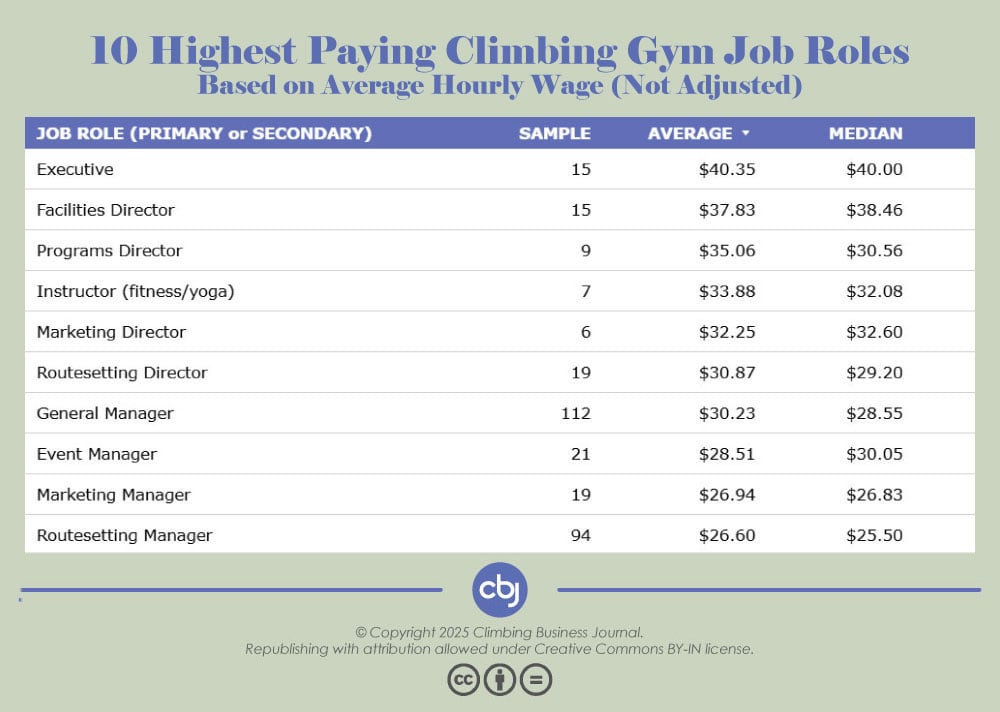
Of the 30 job roles analyzed in the dashboard, seven of them were paying more than $30 per hour, on average, and six of them were paying more than $50,000 per year. Five of the highest paying job roles (based on average annual salaries) from the survey analysis include:
- Executives ($69,291)
- Facilities Directors ($68,087)
- Marketing Directors ($58,041)
- Programs Directors ($55,111)
- Routesetting Directors ($54,531)
Takeaway #2: Leading a climbing gym business can be a promising career
In the climbing industry’s early days, often people would choose to work at climbing gyms because they were simply passionate about the sport, not necessarily because it came with a meaningful paycheck. Nowadays, that passion is still very much a driving force, but there are also several job pathways that can offer a fulfilling and promising career, especially for employees interested in taking on leadership roles at their climbing gym workplaces.
Routesetting Directors who took the survey, for instance—the leaders who guide the crews behind a climbing gym business’s core product—were earning over $30 per hour and over $50,000 per year, on average. And Programs Directors—who manage the primary ways a clientele stays engaged at the gyms—were earning over $35 per hour and over $55,000 per year.
Among the general job categories covered in the survey— gym management, routesetting, coaching, programming, etc.—perhaps nowhere is that observation more apparent than in gym management. On average, surveyed employees working in a gym management position were more likely to earn a higher annual salary ($51,344 on average, across all gym management positions) and more likely to be satisfied with their job (3.9 out of 5 for gym managers, 3.5 for others). Employees in gym management were also more likely (76% for gym managers, 57% for others) to receive at least one form of the benefits listed in the survey (medical/dental/vision insurance, wellness benefits, professional development reimbursements, etc.).

Takeaway #3: The industry has more growth left to come
At the same time, CBJ’s Climbing Gym Staff Compensation Dashboard also shows there is still room for more growth in the years ahead, as the industry evolves and expands. Across all the employees who took the survey, the average annual salary was about $34,237, and among employees in the U.S. the average was $35,994. That latter figure is roughly 17% less than the $43,289 per capita income for the U.S. reported by the U.S. Census Bureau.
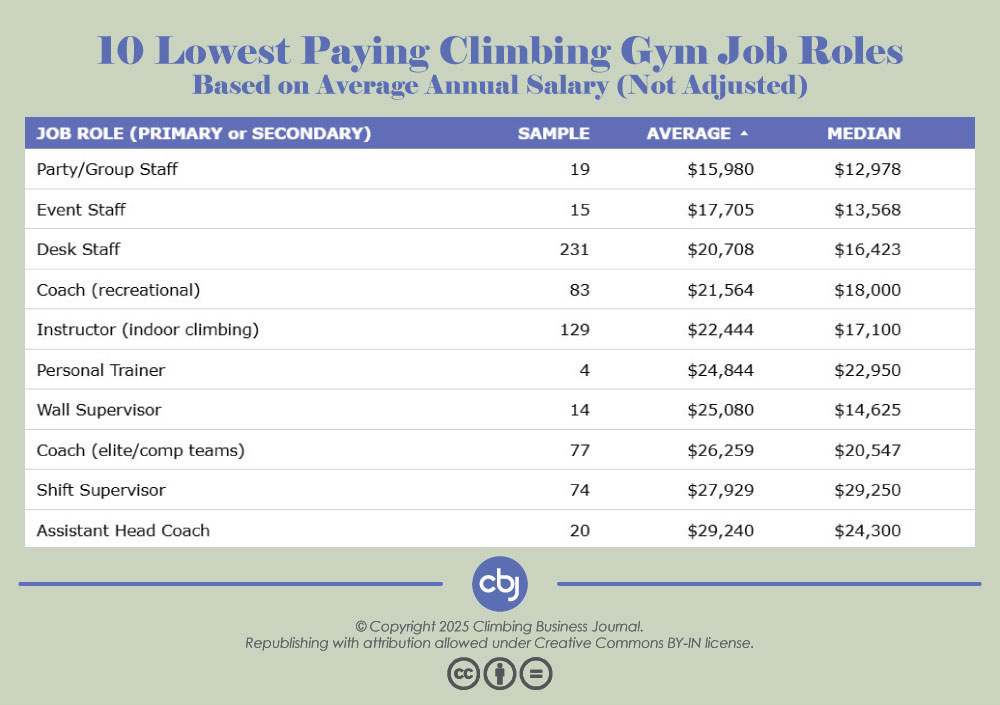
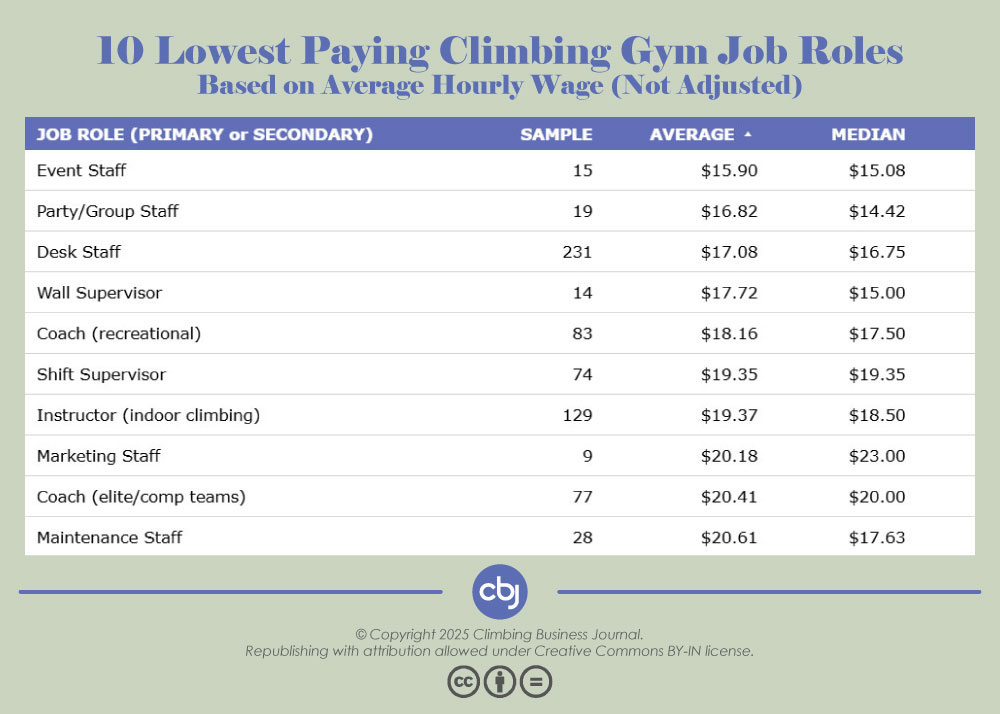
On the low end of the spectrum, seven of the analyzed job roles were paying less than $20 per hour, on average, and six of them were paying less than $25,000 per year. Five of the lowest paying job roles (based on average annual salaries) from the survey analysis include:
- Party/Group Staff ($15,980)
- Event Staff ($17,705)
- Front Desk Staff ($20,708)
- Recreational Coaches ($21,564)
- Indoor Climbing Instructors ($22,444)
One factor influencing these averages was an employee’s job classification. While the majority of survey respondents were working full time at their climbing gym workplaces, 43% were working in part-time or temporary capacities. Among the five lowest paying job roles that figure jumps to about 70%, suggesting there may be fewer full-time opportunities for those roles.
An employee’s job classification also had an impact on benefits. About 82% of employees in full-time positions indicated they had been offered at least one form of the benefits listed in the survey, whereas among employees in part-time or temporary capacities that figure drops to 36%, indicating many of those employees may not have access to health insurance at their workplaces.
Takeaway #4: There’s more work to do to bridge income gaps
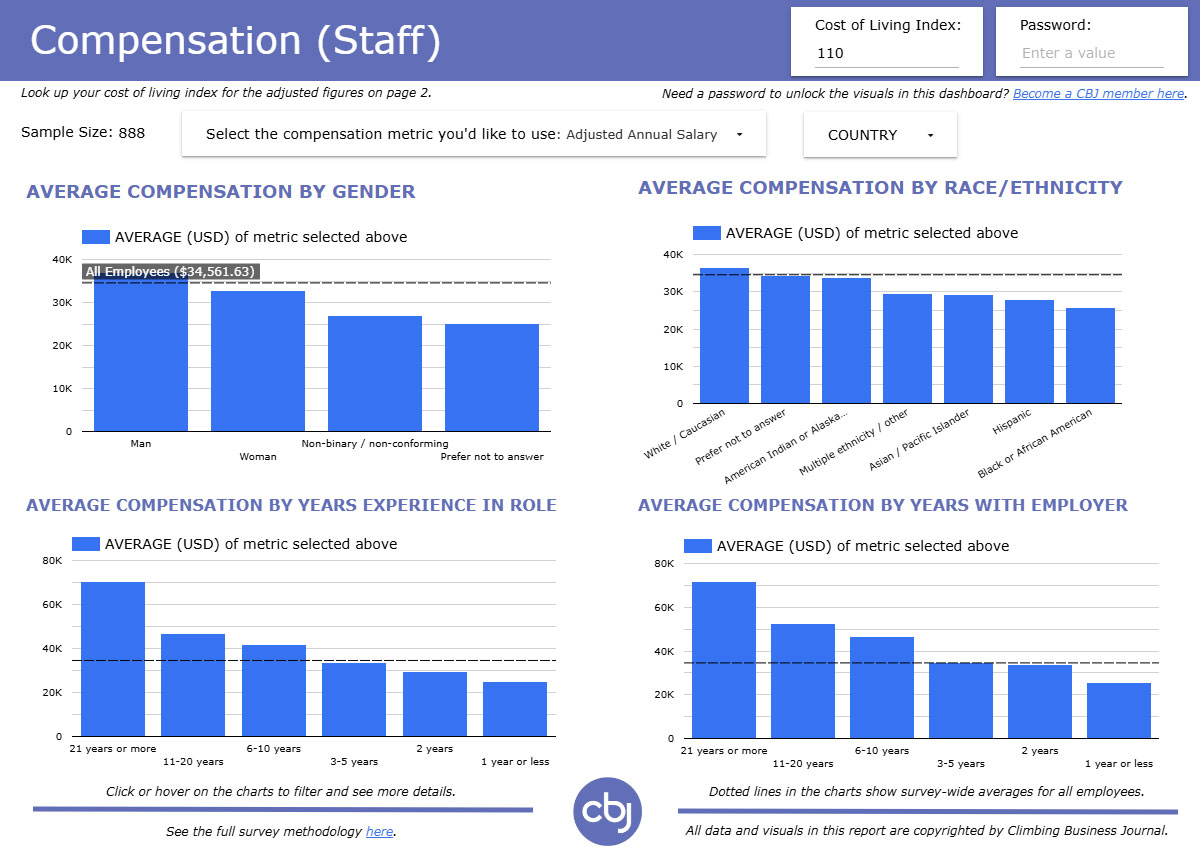
Another takeaway that stands out from CBJ’s Climbing Gym Staff Compensation Dashboard is the difference in compensation across genders and races/ethnicities. Gender and racial income gaps have long been discussed within and outside the climbing industry (more facts and figures can be found at the U.S. Census Bureau, for instance), and the results from CBJ’s Climbing Gym Staff Compensation Survey confirmed there’s more work to do to bridge those gaps.
Among all the climbing gym employees surveyed, the average annual salary was about 7% lower for women than men. That difference was even starker for non-binary or non-conforming employees; the average annual salary was about 23% lower for them than men:
- Men: $35,857
- Women: $33,499
- Non-Binary: $27,435
- Prefer not to answer: $26,067
Notable differences were observed across races and ethnicities, as well. Among surveyed employees who are either American Indian or Alaska Native, Asian or Pacific Islander, Black or African American, Hispanic, or have multiple or other ethnicities, the average annual salary was about 15% lower than the average for white employees. And for employees who are Hispanic or Black or African American, that figure rises to about 21%:
- White: $35,508
- American Indian or Alaska Native: $35,111
- Asian or Pacific Islander: $30,977
- Multiple or other ethnicity: $30,641
- Hispanic: $28,217
- Black or African American: $28,177
- Prefer not to answer: $35,866
Also noteworthy is that these trends were largely consistent across the various experience levels reported in the survey. Especially at the ends of the spectrum—among surveyed employees with many years of experience in their job roles (11 years or more) and employees who are relatively new to their job roles (2 years or less)—the average annual salary was higher for men and white employees, indicating income gaps exist across multiple job experience levels.
Takeaway #5: Cost of living is an important part of the equation
Finally, when considering these figures and others from CBJ’s Climbing Gym Staff Compensation Dashboard, there are notable differences between earnings that have been adjusted for cost of living and those that have not. In general, when adjusting the hourly wages and annual salaries to what an equivalent wage or salary would be in an area with the national average cost of living in the U.S. (i.e., a cost of living index of 100), the compensation figures in the dashboard are typically less than they were without applying that adjustment.
One of the reasons for that drop is that climbing gyms are often located in more populated areas, where there is often a higher cost of living. Among U.S. respondents, on average the employees were working in a metropolitan area with about a population of 3.9 million, a per capita income of $46,700, and a cost of living index of 115 (above the national average of 100 and above the survey-wide average of 110). As a result, compensation in these urban areas doesn’t go as far.
Comparing cost of living data is an important reminder that determining compensation is a complex equation. In addition to the location of a gym, other contributing factors—such as a gym business’s size and pricing; an employee’s experience level; whether the work includes managerial responsibilities; and the type of work being performed—can all come into play.
Fortunately, the average compensation calculator in CBJ’s Climbing Gym Staff Compensation Dashboard incorporates many of these factors into the equation, with the ability to modify the cost-of-living-adjusted figures in the dashboard to what an equivalent hourly wage or annual salary would be in your area, based on the survey analysis. After looking up your area’s cost of living index on Page 2, head on over to Page 9 of the dashboard to enter these inputs and see how the compensation you’re earning or offering compares to the survey-wide averages.
Methodology
The CBJ Climbing Gym Staff Compensation Survey was conducted in 2024 and ran from November 29 to December 31. The survey was posted on Climbing Business Journal’s digital platforms and was conducted and distributed in partnership with Expensive Boulders.
Respondents
A total of 888 climbing gym employees responded to the survey, representing 25 countries altogether. The majority of responses came from the United States (81%), followed by Canada (9%). Although the survey results were limited by the sample size, a variety of genders, races/ethnicities, experience levels and job roles were represented in the survey, providing a data-driven snapshot into how much compensation employees at climbing gyms around the world are earning.
Topics
The questions in the survey spanned a variety of compensation-related topics and covered the following:
- Employee Demographics: gender, race/ethnicity, country
- Facility information: location, business size, climbing type, daily/monthly cost
- Job classification: whether an employee was working full-time, part-time or temporary
- Job structure: whether an employee was considered a “full employee” or “contractor”
- Job experience: the number of years an employee had been working in their current job role or with their current employer
- Job roles: an employee’s primary and, if applicable, secondary job role at the facility
- Job satisfaction: on a 1 to 5 scale, with 1 signifying an employee is “not satisfied” with their job and 5 signifying “very satisfied”
- Compensation structure: whether an employee’s compensation was structured as an hourly wage, annual salary, daily wage, or per unit (per route, per class, etc.)
- Compensation currency: the currency in which an employee was paid
- Compensation amount: the amount an employee was paid in that currency
- Compensation raises: when an employee last received a raise in compensation
- Benefits: which benefits an employee had been offered, of the options provided in the survey (medical/dental/vision insurance, wellness benefits, professional development reimbursements, retirement plans, life insurance, profit sharing, tuition assistance)
- Cost of living: information related to the cost of living where an employee works (cost of living index, median/mean household income, per capita income, total population)
Privacy
Every effort was made to protect the privacy and identity of all the employees who responded to the survey as well as the facilities where those employees work. Survey respondents were given the option to not provide the name and location of their current employer and instead only provide basic facility information (business size, climbing type, daily/monthly cost) and cost of living information. If the name and location of a current employer was provided, these details were only used to look up basic facility information from CBJ’s comprehensive Gym Map as well as cost of living information. (CBJ’s full data privacy policy can be found here.)
Currency
All compensation figures in this report and the CBJ Climbing Gym Staff Compensation Dashboard are shown in U.S. dollars (USD). These figures were calculated using the currencies reported by the survey respondents and publicly available exchange rate data provided on the World Bank Group website, which was accessed in June 2025. Some estimation was used to compare USD values across different compensation structures and job classifications.

Cost of Living
The cost-of-living-adjusted compensation figures in CBJ’s Climbing Gym Staff Compensation Dashboard were calculated using a mix of publicly available and proprietary data. Compensation figures for employees outside the United States were initially adjusted to U.S.-equivalent values, based on publicly available cost of living data provided on the WorldData website, which was accessed in June 2025. This global cost of living index is based on a value of 100 for the United States and, according to the website above, combines “the OECD, the Worldbank, the IMF and Eurostat figures and has been completed by [WorldData’s] own researchers.”
Compensation figures for employees within the United States were also initially adjusted to a value of 100, but this time based on proprietary, national cost of living data provided by The Council for Community and Economic Research (C2ER), the leading source of cost of living data in the U.S., with 100 representing the national average. To ensure the most survey responses could be tied to a relevant cost of living index, C2ER’s metro-level index was used (for May 2024), which is “based on an econometric model that identifies key determinants of an area’s cost of living,” per the C2ER website.
Other information related to the cost of living where an employee works that was incorporated in CBJ’s analysis included 2022 five-year American Community Survey (ACS) data for metropolitan/micropolitan core-based statistical areas (CBSAs), reported by the U.S. Census Bureau. These figures included the median household income, mean household income, per capita income and total population for a CBSA. Five-year estimates for 2022 were chosen because these figures are more stable and comprehensive than one-year ACS estimates and because they provided the most up-to-date, complete data for the CBSAs used for C2ER’s metro-level cost of living index, referenced above.
Job Roles
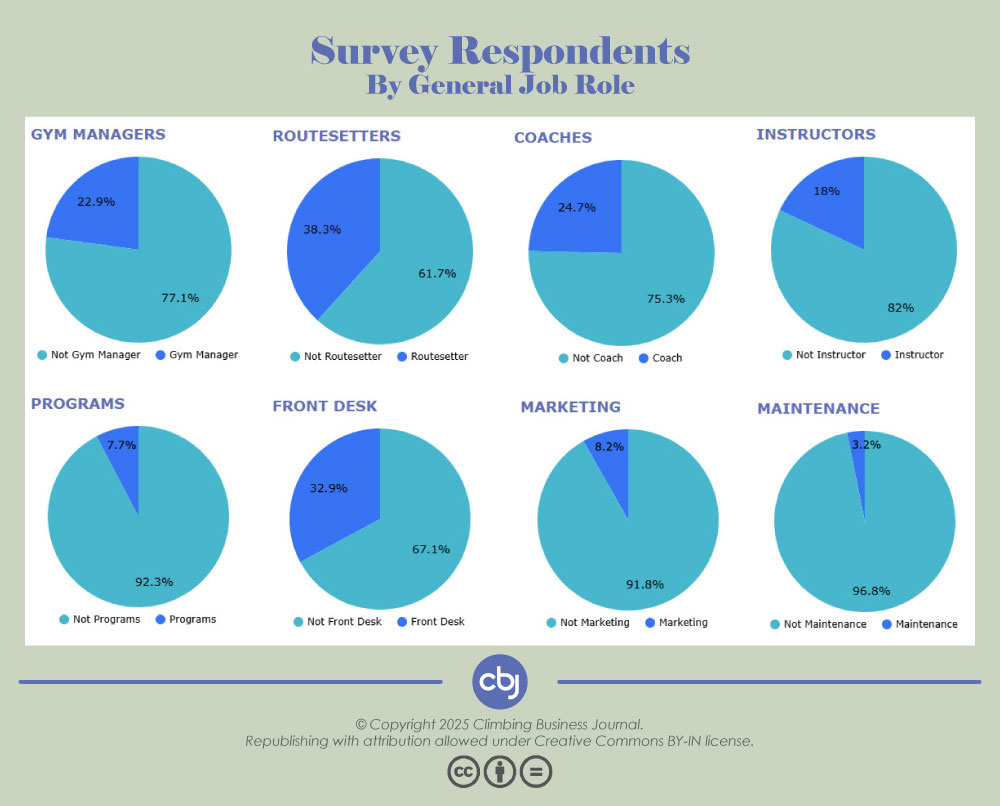
Employees were asked in the survey to select their primary job role and, if applicable, a secondary job role from the list of options provided. If an employee selected both a primary and secondary job role, their compensation was counted for both roles, and in the case where two compensation figures were provided those pay rates were averaged. Job roles were also delineated as managerial or staff roles, based on whether some managerial tasks were expected to be part of the work, and not necessarily whether hiring duties were involved (please note that the National Labor Relations Board may have different definitions for what constitutes a managerial versus staff position at a climbing gym). The list of job roles provided in the survey spanned the following positions in gym management, routesetting, coaching, instruction, programming, the front desk, marketing and maintenance (with job roles delineated as managerial positions in italics):
- Gym Management: executive (chief executive, financial, human resources, marketing or operations officer), facilities director, general manager, assistant manager, retail manager
- Routesetting: routesetting director, routesetting manager, assistant head routesetter, routesetter
- Coaching: head coach, assistant head coach, coach (elite/comp teams), coach (recreational)
- Instruction: instructor (fitness/yoga), instructor/guide (outdoor climbing), instructor (indoor climbing), personal trainer, wall supervisor
- Programming: programs director, programs manager, party/group staff
- Front Desk: shift supervisor, desk staff
- Marketing: marketing director, marketing manager, event manager, marketing staff, event staff, photo/video staff
- Maintenance: maintenance staff
Benefits
Survey respondents were also asked to select the additional benefits offered at their workplace from the list of options provided (medical/dental/vision insurance, wellness benefits, professional development reimbursements, retirement plans, life insurance, profit sharing or tuition assistance). In the dashboard, an employee was considered to not have “any” benefits if none of these options were selected. Write-in options were not factored into the analysis. Paid time off (PTO) was not part of this survey but will be covered in greater detail in future editions.
Limitations
Some limitations of this report and accompanying dashboard are inherent to that of any survey-based analysis, including a limited sample size that may not be fully representative of different job roles at different climbing gyms in different places. In the future, a larger segment of employees in the climbing industry could be surveyed for an even more robust analysis.
Additionally, not all job roles are titled the same way across different facilities. Sometimes an employee at one facility may be working in a “programs manager” role, for instance, that may be comparable to a “programs director” role at another facility. In the next survey, more tips could be provided to help employees make the most applicable selection for their job role in the survey.
Finally, there can be large differences in contexts across different areas and countries. While cost of living data was incorporated into this analysis to help account for some of those differences, comparing compensation figures across different places is still not always an “apples-to-apples” comparison. Whether a country has universal healthcare and other social support services, for example, can significantly impact these comparisons. In subsequent editions of this report and dashboard, additional economic, political and social factors could be factored into the equation.
Acknowledgements
Thank you again to everyone who brought CBJ’s Climbing Gym Staff Compensation Survey & Dashboard to life, including:
- All the employees who made this analysis possible by taking the survey!
- Joe Robinson, who built the dashboard and drafted this report.
- Scott Rennak, who built the survey and guided each step of this project.
- Stefanie Myr, who rekindled this project and amplified its reach.
- Naomi Stevens, who provided detailed feedback on the survey and dashboard.
- The entire CBJ team, who keep us going strong (John Burgman, Jamie Strong, Holly Chen, Devin Dabney, and many others)
- And all the advertisers and members in the CBJ family, who power our work.